
 The San Diego Chargers led the NFL last year with +24 net turnovers. After starting the season slowly with a 1-3 record, they went on to finish 11-5, including ending the regular season on a 6-game win streak. The streak was in large part due to their phenomenally high defensive interception rate. Led at CB by second year sensation Antonio Cromartie who topped the league with 10 picks, San Diego posted an amazing 5.4% interception rate. Unfortunately for Charger fans, interception rates like the this just don't repeat themselves. I'll illustrate exactly why we shouldn't expect the Chargers to duplicate their dominant performance in 2008.
Previously, I've found that team defensive interception stats are extremely inconsistent. The more consistent a stat is, the more likely it is due to a repeatable skill or ability. The less consistent it is, the more likely the stat is due to unique circumstances or merely random luck. In other words, interceptions are thrown far more than they are taken. They have everything to do with who is throwing and with the non-repeating circumstances of the moment.
Defensive interception rates don't even correlate within a season. Offensive interception rates correlate from the first half of a season to the second half with a 0.27 correlation coefficient. In contrast, defensive rates correlate at a much lower (and nearly insignificant) 0.08 coefficient.
Personally, as a Ravens fan I found this hard to accept. Part of the reason I had high hopes for a repeat of their 13-win effort in 2006 was their ability to generate interceptions. I even debated with a reader that interception rates were indeed due to a persistent skill. But now I've come around thanks to a sobering 2007. But Ravens fans are not alone. The 2002 Buccaneers, the 2005 Bengals, and the 2003 Vikings--the teams with the highest interception rates since the 2002 expansion--all suffered dramatic declines the following year.
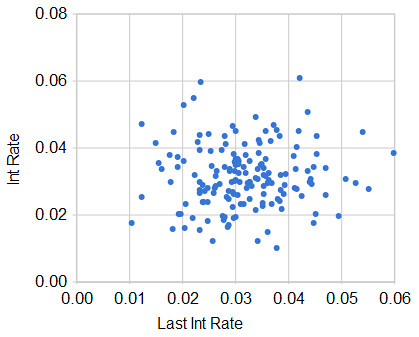
The chart below plots current year interception rates against the previous year's rates for each team from 2002-2007. If there were any persistence of high or low rates we'd see a trend from from the lower left to the upper right. In fact, we don't see any trend at all, just a big blob. This indicates that interception rates are non-persistent and highly random from year to year.
Interception Rate vs. Previous Yr Interception Rate
 The next chart is further illustration of the randomness of defensive interceptions. It is a picture of an unyielding force in nature--regression to the mean. If interceptions are indeed random, we should expect a very strong tendency for teams to regress to the league mean from one year to the next. The year-to-year change in each team's interception rate is plotted against their previous rate. Despite some random dispersion, the trend is very clear--almost all teams with poor interception rates drastically improved the next year, and virtually all teams with very good rates significantly declined.
Yr-to-Yr Change in Interception Rate
vs. Previous Yr Interception Rate
vs. Previous Yr Interception Rate
 Take the team furthest in the upper-left corner. That was the 2005 Raiders, who managed only a 1.0% interception rate. In the following season, the Raiders improved by 2.7 percentage points to a solidly above-average 3.7% rate. (The average is 3.1%.) On the other side of the chart, take the 2006 Ravens. They posted a 5.5% interception rate only to fall 3.3 percentage points to a very poor 2.2%. Very high and very low interception rates just don't persist.
 Why are interception rates so random? First, they are by nature fairly chaotic and complex events. Tipped and bobbled passes contribute to a team's total. Second, because interception stats are relatively persistent for an offense, defensive stats are driven by who the opponents happen to be. Most opponents rotate from year to year, and poor division opponents tend to improve while good ones tend to decline. Lastly, extremely good performances are usually due to a confluence of favorable factors such as injuries, player match-ups, or even weather conditions. There is no reason to expect such good fortune in consecutive years.
I'm not predicting the Chargers rate will be below average or even average. However, I am saying it is extremely likely that the Chargers will have far fewer interceptions in 2008 than they did last year. Based on recent history, by far the best bet is that they'll be pretty close to average. There's almost no possibility they'll have another year with anything close to the 5.4% rate from 2007.
Based on the historical regression trend, the Chargers would be expected to decline by 2.1 percentage points to a very average 3.3%. If the Chargers face a similar number of pass attempts as they did in 2007, they'd go from 30 interceptions to about 18.
Further, we can estimate what kind of effect this decline could have on the Chargers' record using the regression model very similar to the one discussed here. In short, all other factors being equal, a team can expect to win about 0.6 fewer games for every 1.0% decline in interception rate. In the Chargers' case, this translates to a difference of 1.3 fewer wins. The Bolts could defy gravity, but don't hold your breath.
That Cromartie INT pictured at the top was absolutely insane.
ReplyDeletePeyton's 6 INT game was a big part of the Chargers high INT rate. One phenomenal play by Cromartie, one hot route pass tipped straight up by the blitzer, one bad route by a 3rd string WR, one pass tipped by the intended receiver right to a defenser, one picked off Hail Mary. That game gives a great example of the luck/randomness of INTs.
Since the offense (QB) drives the interception rate, are the QBs scheduled to face San Diego's defense this season significantly better/worse than the QBs the defense faced last season?
ReplyDeleteOK, I'll buy the idea that randomness & regression-to-mean render interceptions a poor predictor of future defensive success. What defensive stats would you expect to be better predictors? Not fumbles recovered. It seems like points allowed might also be subject to randomness and the variability of the offense, although perhaps to a lesser extent than turnovers. How about total yards allowed? Punts forced? What else?
ReplyDeleteTotal yards allowed is also very offense-dependent (your own offense). I'd start with yards per rush and net yards per pass. Both correlate from yr-to-yr at about .25 or more. It's not a lot but its a start.
ReplyDeleteWhile I agree with the randomness argument and data, check out the Bolts schedule this year. One of the two easiest IMHO based on facing high powered offenses with strong passing attacks. With the Bolts scoring machine humming along, I'd bet they beat the average INT rate this year, and repeat as a top 5 DST.
ReplyDeleteThe rate at which you cause interceptions isn't chaotic and random. The Chargers caused roughly the same amount of would be interceptions in 2006 and 2007.
ReplyDeleteThe rate at which you catch those interceptions is however different. Instead of Drayton Florence dropping 7 would be interceptions in 06, Antonio Cromartie caught them.
If you didn't notice the Ravens didn't sustain the rate at which they caused interceptions with a pass rush that fell off the face of the earth.
Its seems to me that another factor causing regression to the mean would be once a CB establishes himself as a guy who can pick off alot of passes and return them for TDs, as Cromartie did last year, he might get thrown at alot less.
ReplyDeleteI don't know how much of it was fact or fiction, but I seem to remember that being a big theory about Dion during his prime, that teams just wouldn't throw to his side for fear of the consequences
If that's what's actually happened back then, or this upcoming season with Cromartie, it would seem like a CB could have a pretty big impact over the game with out ever making a play
Your idea that a high scoring team will naturally "regress to the mean" the next season is erroneous. If interceptions are random, as you claim, then each season's interception stats are independent variables and the teams ability to get high interceptions one year will have no impact on the next years interceptions. The law of large averages implies that the team's average season stats will migrate towards center, but that's over hundreds or thousands of seasons, not one season to the next... so your premise is flawed. This is all stats 101.
ReplyDeleteAnyway I don't buy that interceptions are entirely random anyway, and the picture on the top of this page proves it. Most defensive players wouldn't even attempt to go for that catch. It's just as much skill and mindset as it is luck.
Sorry... that's the law of large numbers... there's no such thing as the law of large averages or the law of averages.
ReplyDeleteAnon-First, if you don't buy that def int rates are effectively random, see this article.
ReplyDeleteSecond, it sounds like you don't understand what regression to the mean is all about. 'Independent variables' does not mean that each outcome is equally likely. The frequency of interception rates, just like almost any random variable, is clustered around the mean--it's a normal/Gaussian distribution. So it's far more likely that the SD defense will have close to an average int rate than another year of a phenomenally high rate. It doesn't take hundreds of seasons! That's hilarious. It's possible they'll repeat, but very unlikely.
How's SD int rate so far this year? I thought so. Good luck on your Stats 101 redo! Let me know if you pass this time.
Hindsight is truly 20/20: well-analyzed, well-written.
ReplyDelete