
 I recently looked at how often offenses go for it on 4th down. But I think most 4th down conversion attempts are a function of how desperate a team is in the final minutes of a game. I'm convinced teams should be going for it far more often than as a matter of doctrine, not just as a last ditch tactic when trailing late in the 4th quarter.
In this article I'll look at tendencies on 4th down. To filter out the element of desperation and only look at how coaches and coordinators make 4th down decisions as a matter of routine, I'll look at first quarter situations only. Except in the rarest of games, teams are not outscored so badly that they become desperate before the end of the 1st quarter. First quarter situations would therefore reveal the baseline NFL doctrine for 4th down decisions.
The graph below illustrates how frequently teams punt, attempt a field goal, or go for it on 4th down situations at each yard line on the field.
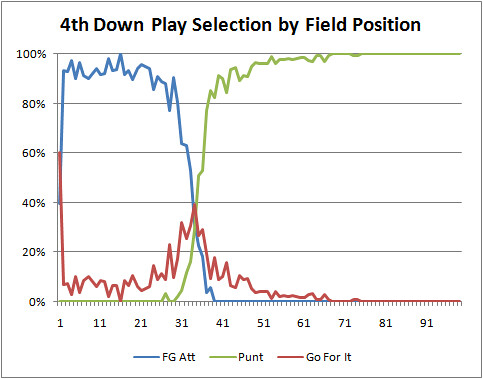 The 34 yard line is the "no man's land" of 4th down decision-making--too close to punt, too far to try a field goal. Outside of the 34, offenses tend to punt. Inside the 34, teams tend to kick field goals. The 34 yard line is where field goals become a 50/50 proposition. Outside the 34, the success rate for field goals drops off very quickly. The 34 is also where offenses will go for the conversion most often, nearly 40% of the time.
It seems that coaches aren't really going for the conversion because they believe it works out better for them in the long run, but because they don't have a viable kicking option. They'll go for it only when the safe and conventional alternative is taken away.
I think that graph is pretty cool for some reason. It says a mouthful. But it leaves out perhaps the most important consideration on 4th down--to go distance. There are a lot of variables, so they all can't go on a single graph. The following graphs break out the play-calls by to go distance. Passes and runs are broken out too. Again, these are all for the 1st quarter.
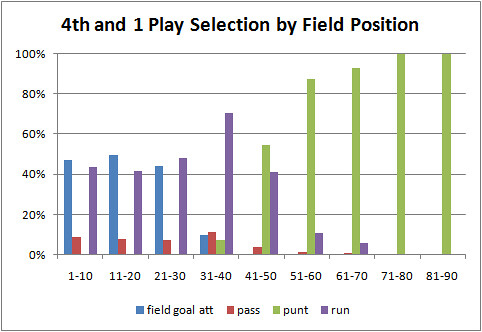

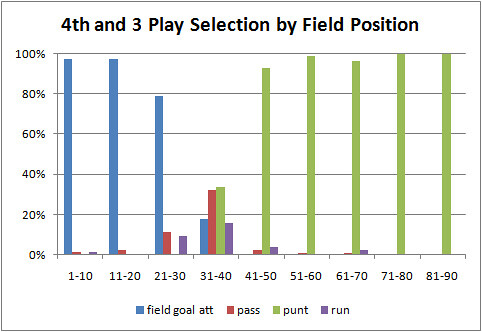

This data is mostly predictable, but there's something fascinating about the 31-40 yardline play selection bars. Once a coach decides not to go for it, the decision to attempt a FG vs. punt appears to be dependent on how many yards to go. On 4th-and-1, teams kick a FG slightly more often than punt. On 4th-and-2, teams punt slightly more often than kick a FG. On 4th-and-3 and 4th-and-4, teams punt much more often than attempt the FG.
ReplyDeleteUnless there's some bias in the field position data, this doesn't seem to be a rational decision. Perhaps there's a psychological effect of being reluctant to punt on 4th-and-short that's driving these numbers.
Interesting. Sort of like an impulse that says "we came so close to getting a 1st down--we need to come away with some points."
ReplyDeleteBut maybe there is some bias in the data. Perhaps 4th and 1s tend to happen closer to the 30 than the 40 for some reason. I doubt that's the case, but it could explain the difference. I can dig a little deeper to see.
Jim A-Nope, no bias in the data. For between the 31 and 40 yd-lines, the avg field position for 4th down and every to go distance up through 4th and 20 is the 35.6, with almost no variation.
ReplyDeleteSo I bet you're right--there's some irrational effect pushing coaches to try the field goal more often with shorter to go distances given equal field positions.