
 Last July I wrote that the Chargers defense would appear to significantly decline in 2008, even with no change in skill or performance. The reason was that they could not possibly repeat their phenomenally high defensive interception rate. At the halfway mark this season, the Chargers evidently don't think they're doing very well because they just fired their defensive coordinator. But is the Chargers defense really that bad, or is it just unlucky?
Last season San Diego led the NFL with an insanely high 5.4% interception rate. That means they intercepted more than 1 out of every 20 passes attempted. But because defensive interceptions are almost completely random, I forecast that the overwhelming likelihood would be that their 2008 interception rate would be far closer to average. In fact, it's currently well below average at 2.2%. The average so far this year is 2.6%.
Using regression coefficients to weight the importance of each major efficiency stat, we can estimate that the difference in defensive interception rate from 2007 to '08 would cost San Diego 2.6 games over the course of a full season, or about 1.3 games so far this season.
Aside from their interceptions, the Chargers' pass defense is still above average but not as good as last year. So far in 2008, San Diego has allowed 6.2 net yards per attempt compared to an NFL average of 6.3. Last year, they allowed 5.7 net yards per attempt. On average, this would have cost them a difference of 0.8 wins over the course of a full season, or 0.4 wins so far.
Their defensive running efficiency is exactly the same at 4.2 yards per attempt. That's slightly worse than average, which is 4.1 yds per att.
In total, the Chargers interception rate (which is overwhelmingly random) accounts for an estimated 1.3 wins out of a total difference of 1.7, or about 75%.
So Ted Cotrell was fired as defensive coordinator for a drop-off of half a yard per pass attempt, or just less than half a win. The unfortunate loss of pass rusher Shawne Merriman to injury would easily account for such a difference. Now I'll make a new prediction. Because San Diego's interception rate has been so low this year, it's bound to improve (i.e. regress to the mean), and most people will think Cotrell's replacement, Ron Rivera, is to thank.
My point isn't that the Chargers have lost precisely 1.7 games fewer this year because of their defense. My main points are: 1) if you didn't buy how random defensive interceptions really are, maybe you'll reconsider; 2) Cotrell probably shouldn't have been fired; and 3) expect the Chargers defense to improve for the remainder of the year, if only because their interception rate is likely to improve.
San Diego's Defensive Woes

Play of the Week
 With a 21 to 17 lead midway through the 4th quarter, the NY Jets drove to the Kansas City 8 yard line. A virtually certain field goal would have given them a full touchdown lead and guaranteed New York at least one more full possession. This situation gave the Jets about an 85% chance of victory. But on 3rd and 2, Brett Favre was intercepted for the 3rd time in the game, this time by Chiefs CB Brandon Flowers who returned the ball 91 yards for a touchdown and a 3 point lead. Following the extra point, the Chiefs had an 80% chance of winning, for an amazing swing of 65%.
But the Jets got the last laugh. Their final drive culminated in a 15-yard TD pass to Laveranues Coles to take back the lead for good. The Chiefs had 1:00 to respond. With good field position following the kickoff, Kansas City made it to the Jets' 31 yard line with a 32% chance of pulling out the victory, before stalling on 4th and 1.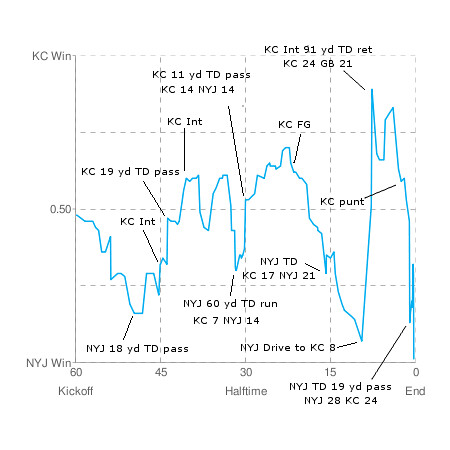
Congratulations, Brandon Flowers. Enjoy your free lifetime subscription to Advanced NFL Stats Premium.
Runner-up this week goes to the Dallas defense that stopped Tampa's final drive in the closing seconds to seal their 13-9 win.
The comeback of the week, however, is owned by the Panthers, who faced a 17-3 deficit against the Cardinals. With ten minutes left in the 3rd quarter, Carolina only had a 5% chance of winning before mounting their comeback. This was about 3 times more improbable than the Jets' amazing win.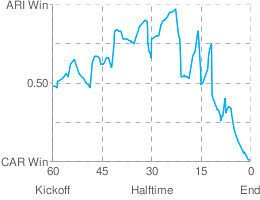
Week 8 Efficiency Rankings
 This week's ratings are listed below in terms of generic win probability. The GWP is the probability a team would beat the league average team at a neutral site. Each team's opponent's average GWP is also listed, which can be considered to-date strength of schedule, and all ratings include adjustments for opponent strength.
GWP is based on a logistic regression model applied to current team stats. The model includes offensive and defensive passing and running efficiency, offensive turnover rates, and team penalty rates. A full explanation of the methodology can be found here. This year, however, I've made one important change based on research that strongly indicates that defensive interception rates are highly random and not consistent throughout the year. Accordingly, I've removed them from the model and updated the weights of the remaining variables.
Offensive rank (ORANK) is the ranking of offensive generic win probability which is based on each team's offensive efficiency stats only. In other words, it's the team's GWP assuming it had a league-average defense. DRANK is is a team's generic win probability rank assuming it had a league-average offense.RANK TEAM LAST WK GWP Opp GWP ORANK DRANK 1  WAS
WAS1 0.82 0.52 3 5 2  PHI
PHI2 0.81 0.58 5 4 3  CAR
CAR4 0.75 0.58 9 3 4  SD
SD3 0.74 0.54 4 16 5  CHI
CHI7 0.70 0.57 10 7 6  NYG
NYG8 0.68 0.42 1 15 7  MIA
MIA12 0.67 0.52 2 24 8  NO
NO9 0.65 0.58 6 18 9  TB
TB14 0.64 0.58 17 2 10  BUF
BUF5 0.63 0.49 21 10 11  PIT
PIT6 0.63 0.48 26 1 12  ATL
ATL11 0.63 0.53 7 21 13  DAL
DAL10 0.62 0.53 12 11 14  ARI
ARI13 0.59 0.61 8 19 15  TEN
TEN15 0.57 0.38 18 8 16  MIN
MIN17 0.50 0.55 22 9 17  GB
GB18 0.50 0.48 14 13 18  IND
IND20 0.49 0.51 13 14 19  NYJ
NYJ16 0.46 0.44 30 12 20  BAL
BAL23 0.46 0.47 25 6 21  DEN
DEN21 0.45 0.48 16 29 22  HOU
HOU24 0.43 0.45 15 30 23  JAX
JAX19 0.43 0.51 11 28 24  OAK
OAK22 0.38 0.51 23 20 25  NE
NE27 0.35 0.45 27 26 26  CLE
CLE28 0.35 0.55 20 23 27  STL
STL26 0.33 0.60 19 27 28  SEA
SEA25 0.32 0.49 24 25 29  SF
SF29 0.33 0.48 31 17 30  CIN
CIN30 0.19 0.53 32 22 31  KC
KC31 0.18 0.51 29 31 32  DET
DET32 0.17 0.56 28 32
The to-date season efficiency stats are listed below.TEAM OPASS ORUN OINTRATE OFUMRATE DPASS DRUN DINTRATE PENRATE ARI 7.1 3.3 0.022 0.027 6.9 4.0 0.014 0.41 ATL 6.4 4.8 0.024 0.009 6.4 4.7 0.021 0.35 BAL 5.7 3.8 0.036 0.030 5.4 2.8 0.042 0.48 BUF 6.8 3.8 0.019 0.028 6.0 3.8 0.018 0.30 CAR 7.1 3.7 0.022 0.018 5.5 4.0 0.019 0.39 CHI 6.5 3.6 0.017 0.019 5.7 3.7 0.035 0.40 CIN 4.1 3.4 0.034 0.035 6.4 4.3 0.017 0.36 CLE 5.3 3.8 0.029 0.024 6.5 4.7 0.045 0.40 DAL 7.0 4.6 0.030 0.036 5.7 3.9 0.008 0.51 DEN 7.0 4.6 0.027 0.032 6.8 5.4 0.009 0.36 DET 5.3 4.2 0.031 0.036 8.4 4.7 0.005 0.42 GB 6.7 3.7 0.018 0.028 5.3 4.9 0.056 0.61 HOU 6.8 4.3 0.033 0.029 7.2 4.5 0.026 0.21 IND 6.2 3.4 0.034 0.009 5.8 4.2 0.025 0.44 JAX 5.8 4.1 0.018 0.014 7.0 4.4 0.027 0.38 KC 4.4 4.4 0.034 0.025 7.3 5.6 0.031 0.28 MIA 7.6 3.8 0.014 0.020 7.2 3.7 0.019 0.30 MIN 5.8 4.3 0.033 0.028 6.3 2.9 0.018 0.46 NE 5.5 4.2 0.028 0.016 6.8 4.4 0.041 0.29 NO 8.1 3.4 0.023 0.031 6.4 4.3 0.021 0.50 NYG 6.7 5.1 0.018 0.014 5.5 3.8 0.038 0.50 NYJ 5.9 4.6 0.050 0.023 6.0 3.2 0.020 0.31 OAK 5.3 4.3 0.015 0.031 6.5 4.5 0.032 0.41 PHI 6.8 4.1 0.016 0.017 5.6 3.5 0.035 0.34 PIT 5.9 3.9 0.036 0.033 4.4 2.8 0.025 0.43 SD 8.1 3.9 0.026 0.017 6.4 4.0 0.019 0.37 SF 6.0 4.5 0.045 0.044 6.4 3.6 0.031 0.48 SS 4.7 4.4 0.036 0.010 6.9 4.0 0.009 0.30 STL 5.3 4.0 0.020 0.023 7.3 4.8 0.029 0.45 TB 5.6 4.3 0.026 0.014 5.5 3.6 0.046 0.48 TEN 5.9 4.3 0.026 0.017 4.9 3.7 0.048 0.38 WAS 6.7 4.7 0.000 0.016 5.5 3.8 0.018 0.35 Avg 6.2 4.1 0.026 0.023 6.3 4.1 0.026 0.39
In-Game Win Probability Engine 0.5
 A big (cosmetic) improvement for tonight's IND-TEN game. The win probability site now uses a new way of updating itself that makes it far smoother, especially for multiple games. Using AJAX, the site will now update itself automatically in the background without having to refresh and redraw the screen every 30 seconds. It might not sound like such an improvement, but the site will lose a lot of the quaint 1990's homemade feel. The updates will be much quicker. No more annoying flicker while the file downloads. And no more scrolling back down to the game you were following (in some browsers).
Final games from Sunday are here.
In-Game Win Probability Engine 0.4
 Improvements to the (near) live win probability scoreboard this week include a model for overtime and a fix for some halftime bugs. The site will also update quicker and feature some minor cosmetic upgrades. The are also a number of behind-the-scenes improvements in the programming. The link is wp.advancednflstats.com. You can see graphs of last week's games here and week 6 games here. Feedback is always more than welcome. I'm currently drafting a post explaining how it works in case anyone is interested. Also, feel free to send in your suggestion for play of the week.
Week 8 Game Probabilities
 Win probabilities for week 8 NFL games are listed below. The probabilities are based on an efficiency win model explained here and here with some modifications. The model considers offensive and defensive efficiency stats including running, passing, sacks, turnover rates, and penalty rates. Team stats are adjusted for previous opponent strength.
Pwin GAME Pwin 0.47 BUF at MIA0.53 0.43 OAK at BAL0.57 0.31 ARI at CAR0.69 0.46 TB at DAL0.54 0.59 SD at NO*0.41 0.28 ATL at PHI0.72 0.17 KC at NYJ0.83 0.44 STL at NE0.56 0.91 WAS at DET0.09 0.31 CIN at HOU0.69 0.30 CLE at JAX0.70 0.39 NYG at PIT0.61 0.35 SEA at SF0.65 0.33 IND at TEN0.67
*See the comment below by Jeremiah regarding the London game. The probability above has been updated to reflect the neutral site location of the SD-NO game.