
 Traditional individual defensive stats don't tell us much. There are tackles, sacks, and turnovers, and that's pretty much it. Recently, I developed "Tackle Factor," a way to make better sense of tackle statistics, at least for the front-seven defenders. It's not perfect, but I think the consensus was that it's a step forward. Still, there's much more that can be done.
Offensive stats are straightforward, but objective defensive stats are problematic. When a running back picks up a 10-yard gain, although other teammates contributed, that's obviously a good play by the ball carrier. And when a running back stumbles at the line for no gain, that's obviously bad. But looking at the same two plays from the other side of the ball is much trickier. A strong safety, say Troy Polamalu, who makes the best play he can by preventing the runner getting past 10 yards, would be be debited for that 10 yard gain. The other four or five defenders who had a chance to make the play sooner, but didn't, aren't mentioned in the play description and wouldn't be docked for the play.
On the other hand, if Polamalu is playing run support, and he reads the play and stuffs the running back at the line, that's certainly to his credit. If only there were a way to credit each defender for plays like this, and at the same time ignore the plays that really should count against his teammates.
A Possible Solution
It might just be pretty simple. All we need to do is add up all the WPA (or EPA) for each play in which the WPA (or EPA) was positive. "+WPA" and "+EPA" add up the value of every sack, interception, pass defense, forced fumble or recovery, and every tackle or assist that results in a setback for the offense.
What these stats measure is "playmaking" ability. When I watch the NFL Films shows, the sideline audio is usually filled with coaches urging on their players with an emphatic, "Go out there and make a play!" Simply stated, +WPA (and +EPA) puts a number on playmaking.
You might be thinking that only looking at prominently positive plays won't tell us much. +WPA doesn't account for the guy who covers his man like a blanket and never has to make a play. It doesn't account for the nose tackle who holds his ground against the double-team and lets the linebacker make a play. It might reward a gambler, someone who abandons his responsibility chasing the ball. All true. +WPA doesn't account for all the hidden action not reported in the play-by-play, not directly anyway. But does this mean we should ignore it?
The Theory
Think of a player like a corporation. Companies have revenue, which would be +WPA, and they have expenses, which would be -WPA. Revenue minus expenses tells us how much profit or loss a company has, which would be net WPA. Because of the Polamalu problem discussed above, we can't know a defender's expenses from the existing play data, but we can know much of his revenues, his +WPA.
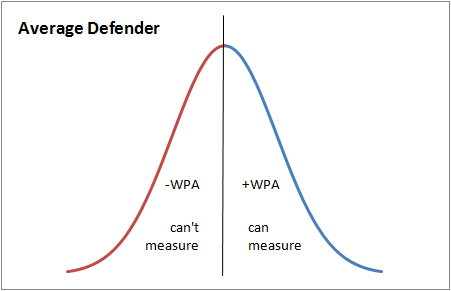
Unlike a company, however, (as Wall Street sadly learned a couple years ago) a player's individual performance from play to play almost certainly follows a normal distribution. Virtually all aspects of human traits and performance are governed by a bell curve, from height to intelligence to athletic feats. There are many instances when a defender plays near his average level of performance, and there are fewer in which he plays either very well or very poorly. The distribution of an athlete's performance is roughly symmetric with respect to his own mean performance level. Nearly all sports statistics are based in some way on the normal distribution, and each player's performance on individual plays is unlikely to be an exception.
We can see and measure a very large part of a defender's performance using +WPA, but his negative performance cannot be captured because of the Polamalu problem. We can infer his overall performance, however, by what we can see and measure. Assuming a roughly normal distribution of performance, an average defender's per-play distribution of WPA would look like this:
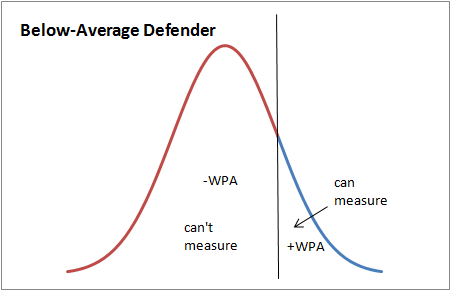
A below-average defender's distribution might look something like this:
And an above-average defender's WPA profile would look like this:
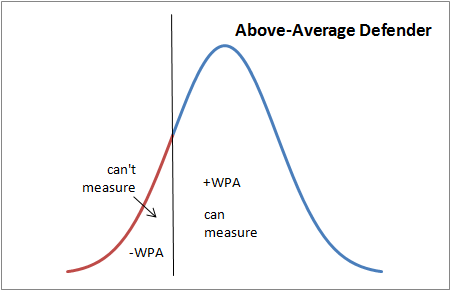
There is likely to be a strong correlation between a defender's visible positive impact and his overall net impact. In other words, we should expect better defenders to tend to have both more positive plays and fewer negative plays. This is because of the symmetric nature of the distribution of human performance.
I'm not suggesting every player's performances conform precisely to a bell curve, and I'm not suggesting we can directly calculate the negative side of the curve. What I do claim is that knowing only part of the curve is not such a bad thing, and that measuring defensive players by only their positive impact could tell us far more than we might think.
Not every defender would have the same normal profile. As I mentioned above, there are the "gamblers," players who shoot gaps when they should be reading the play or cornerbacks who jump pass routes when they should stay in position. Certainly, +WPA and +EPA would be biased in favor of these types of players. But if their gambles were really hurting a team, I doubt they'd be given much slack and playing time by their coaches. Only 'winning' gamblers, who are taking smarter risks, would tend to survive long in the NFL.
And I doubt very seriously these players would have a drastically non-normal profile. Even the most reckless gambler can't roll the dice that often. His distribution may be flatter or more skewed than the typical player, with more plays with extreme outcomes, but his overall profile would likely still be roughly symmetric, with more average plays than outliers at either extreme.
Support from Baseball
Baseball stats, which can directly measure +WPA and -WPA, lend support for this theory. Fangraphs.com conveniently breaks out the +WPA, -WPA, and net WPA for each MLB batter. +WPA alone does a very good job of identifying the best hitters. Recent seasons belonging to Alex Rodriguez, Albert Pujols, Prince Fielder, Ryan Howard, Matt Holliday and Manny Ramirez top the list.
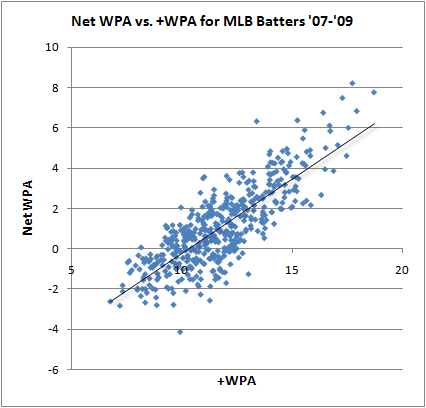
For the top 154 batters in each of the last three seasons, the standard deviation of +WPA was 2.15, while the standard deviation of -WPA was 1.28. This suggests that players differ primarily due to their positive impacts, while their negative impacts are relatively alike.
In fact, over the last three MLB seasons, +WPA correlates with net WPA at 0.81, while -WPA correlates with net WPA at only 0.17. In other words, positive performance is the primary driver of overall performance, at least at the elite level. Here is the same point in graphical form. Player +WPA is plotted against his overall net WPA. You can see how tightly they correlate.
Although baseball is a very different sport, and player contribution can be measured much more precisely, the principles of athletic performance largely remain the same. And if these principles hold for WPA, they would be true for EPA as well.
Application
Can +WPA really tell us who the best defensive players are? Let's see if the top defenders in +WPA for 2009 make sense. For linebackers, there's Jonathan Vilma, David Harris, LaMarr Woodley, Patrick Willis, Gary Brackett, Ray Lewis, James Harrison, Karlos Dansby, London Fletcher, and Terrell Suggs.
The top defensive ends include: Aaron Schobel, Jared Allen, Andre Carter, Will Smith, Ray Edwards, Trent Cole, Alex Brown, Brett Keisel, Mario Williams, and Dwight Freeney. Guys like Julius Peppers, Justin Tuck, and Robert Mathis are right behind.
For tackles, there's: Kevin Williams, Kyle Williams, Jonathan Babineaux, Darnell Dockett, Justin Smith, Albert Haynesworth, Jay Ratliff, Tommie Harris, Marcus Stroud, Vince Wilfork, and Pat Williams.
Still not convinced? Here are the top cornerbacks: Darelle Revis (who else?), Dominic Rodgers-Cromartie, DeAngelo Hall, Charles Woodson, Asante Samuel, and Tracy Porter. Rhonde Barber and Champ Bailey are not far behind.
And lastly, here are the safeties for 2009: Bernard Pollard, Darren Sharper, Jim Leonhard, Brian Dawkins, Adrian Wilson, Roman Harper, and Ed Reed. Care to guess #1 and #2 from 2008? Troy Polamalu and Ed Reed.
+WPA produced an impressive list of players. Just consider the Pro-Bowl appearances belonging to those players. (This might mean Pro Bowl selections ignore negative performance, just like +WPA does. Or it means +WPA is a pretty good stat for defenders. I think it's probably a little of both.)
Conclusion
At best, +WPA and +EPA only tell half the story. But if you read enough stories, halfway through you kind of know how they're going to end. The big point is that the performance we can't see and measure correlates tightly with the performance we can see and measure. We can invent all kinds of scenarios where these stats aren't going to be unfair to this player or that player. And the truth is no objective, quantitative football statistic will ever capture every individual contribution of a player, but +WPA and +EPA are a good start.


Interesting stuff, as always. I wonder if it would be feasible to directly compare defenders at different positions, or the same position on different teams, or even guys who are in a rotation, by expressing their +WPA as a fraction of that of the whole defense, or their +WPA in terms of the average for that position.
For example, the entire Vikings front four are on your list, so it looks simple enough to tell which of them adds the most value to the Vikings. But does Jared Allen add more to the Vikings than Will Smith does to the Saints? Is Trent Cole or Asante Samuel more valuable to the Eagles?
Bernard Pollard was cut by the Chiefs at the start of the season, and in only 13 games with the Texans he's the most valuable safety?
I wonder though, does +WPA possibly measure the amount a coach rates a player?
For instance, let's take a simple assumption that in a +WPA situation, any one of the 11 defenders could have made the play with equal probability. If the coach rotates his players in line with their ability (i.e. the better players play more plays) then you would end up with a system biased towards the players the coach thought was better.
My assumption could well be wrong though, but I just wondered whether a quick test would be to see the +WPA by position by team. If the top +WPA teams matched up with the top +WPA players then there would be good grounds to throw out my assumption.
(As an example, let's say Player A is a SS on Team A plays 75% of the defensive plays and finishes up the season with a +WPA total of +8. Player B on team A plays the other 25% and finishes with +2. On Team B, the coach rotates his SS (Player C and D) so that each of them only plays 50% of the plays and both of them end up with +4. On the raw measure, Player A looks to be loads better (and he may well be, given the coach trusts him to play more) but the numbers would suggest that if each of B, C or D played as many plays as A, they would come up as the best).
Typo on that post - meant Player C and Player D both finish with +5 on +WPA plays
I know you're trying to do the very best with the play-by-play data that you have available to you, and I certainly commend you for that. But I have serious problems with your contention that you can currently measure the +WPA for defensive players. We can probably get much closer to measuring +WPA for defensive players than you can for -WPA, but I think we're still a long way off from quantifying a defender's +WPA.
I would contend that a shutdown corner (e.g., Darrelle Revis) has a positive WPA impact on almost every play. Yet this impact cannot usually be measured with the play-by-play narratives. When a QB routinely throws AWAY from the shutdown corner, that CB will probably not even show up in the narrative - but he had a huge impact on the play. If the CB does not show up in the play-by-play because everyone's throwing away from him, we're not missing the measurement of -WPA. We're missing the measurement of +WPA.
As another example, in a 3-4 defense, the defensive line's primary job is to act as "blockers" for the LBs. They tie up the offensive line so that the LBs can roam free and make plays. This is another example where a DT/DE may not even show up on the play-by-play, but if he tied up an OL (or a couple of them) he had a +WPA impact.
So it is my contention that we are currently missing ALL of the -WPA and (for some players at least) a significant portion of the +WPA. This makes it much more difficult to infer a true WPA impact.
I think that looking at WPA+ as a PROPORTION of the overall defensive WPA+ of the team would also be interesting. How would it look differently?
Brian,
Very interesting research, and a great way to look at the problem. Maybe this is your plan already but I would wonder then if we can anticipate what total WPA would be based on how the distribution of WPA (even better yet EPA) between negative and positive is for the offensive side of the ball.
Secondly, one issue that I think this method may have is with a player like Amosogua (sp?) on oak. Since a team is not throwing to him you could argue that he is creating +epa on every play. Maybe you could come up with a base approximation for EPA for all players then make some additions/subtractions. For cornerback maybe it would include some adjustment like this.
Let’s say hypothetically every pass attempt on average has a +.2EPA and every completion has a +1EPA and every incomplete -.5EPA. If you could determine a good way to split out EPA – Maybe for instance say not being thrown at is worth +.165EPA (since 65% of passes get completed and on average there are 3 WR+1rb/TE that could be in the target field so 1*.65*.25) Again this is a total guess but throwing it out there. Of course you can’t tell who wasn’t thrown at from the PBP data but you can get information like that from a site which watches tape like profootballfocus. So to put this together if you had a simple play in a two WR set one was covered by Cromartie and one by Revis. If the pass completion goes to Revis and it would typically be for +2EPA Revis would really get charged for -2.165 and Cromartie would get a +.165 that nets to 2.
The same issue could come up with a 3-4 nose tackle – The main reason the Lions draft someone like Suh isn’t necessarily to make tackles with great +EPA but to eat up blockers to their linebackers can make +EPA plays. So you would have to have some type of adjustment giving those LB points back to or taking away from the NT. Not exactly sure how this would work but a thought.
I’m sure there are more adjustments that could be made but those are the first two that popped in my mind. I think getting the initial EPA level and make adjustments from there could be a very huge step though. I look forward to see what some of the numbers look like for the various players. Great job!
teasing us aren't you for the inevitable release of defensive player stat pages? i'm salivating already.
I'm not sure that comparing the analysis to what happens in baseball is accurate. Baseball is a very simple game, statistically speaking, and pretty well-characterized. Football is not at all. Basketball might be a better comparison, and if you've read any of Dave Berri's work you know that coaches and GMs don't always do a great job of picking the best players to put on the court. They almost certainly reward gamblers, because people remember big showy plays and not the little breakdowns.
My response to not including all of a corner's WPA is: you're probably right. But it's not just Revis (or anyone else) discouraging the QB throwing in his direction, it's also the safety support over top, blown coverage by another defender, the QB getting sacked before he could have passed, a "coverage" sack where all DBs covered well and the QB had no where to go. I'd say in the end most of that will balance out and WPA+ will be a good general stat to look at.
After all, Revis had to do something to stop QBs from throwing towards him and that should show up in his WPA. It's not like he's never challenged or everyone knew from the start he was good.
I think we can look at this and what specifically it's measuring. For a CB, it's measuring how well the CB does when thrown to. Just like looking at a TE's WPA, it is just measuring his ability in receiving, but not his ability to pass or run block. So I feel that WPA+ can measure certain aspects of a players ability, but can't tell me who is the most complete TE or CB.
Looking at the WPA/WPA+ for Baseball, couldn't this also be done for the offensive skill players in football to see how well that correlates, and see if that can give a better help the argument that WPA+ is a strong indicator of WPA?
The exclusion of Nnamdi Asomugha from the top CBs list shows how much +WPA relies on chances. Asomugha is targeted against very rarely, so I'd like to see a separate list for +WPA/play. Where does he rank on a per-play basis?
Scratch Pollard. That was an error. Somehow he got credited for +0.64 on one play and +0.39 on another on 2 tackles against Jacksonville last season. Both tackles were key stops inside the 10 yd line, but neither comes close to being that big.
Glad to see a lot of Saints make it [Vilma, Smith, Brown (as a Bear, but he's ours now .. that $3mil/yr looks pretty good now and they actually released him!), Porter, Sharper and Harper], but Porter is only the second best CB on the team, and I'm sure he has a pretty high +, but a lot of plays went his way with Greer mostly shutting down the #1.
I think this is a pretty good measure. Much like offensive stats won't tell you if a 1 WR is constantly drawing double teams, opening up other players, or a RB forces 8 in the box, similarly, these stats will miss the "non play playmaker." That's fine. It should only show up as a large issue for CBs (D Hall is a great example of a gambler who gets INTs but gives up a lot of TDs.) A corner who only gets targeted 25 times obviously helps a lot, and won't get captured well. That's ok...as long as you know what it's not capturing.
I agree with some others that if you could do it on a per play basis, it would be even more illustrative.
Does this include quarterback pressures for pass rushers?
to Zach:
I agree that this has a lot of trouble for positions where players SHOULDN'T have many stats, but to do it on a per play basis would simply show the quality of the Raider's defense overall and not be meaningful in regards to Asomugha.
That is if I understand what Brian is doing correctly.
Alchemist,
You're right that +WPA isn't perfect because it ignores the effect players can have by diverting a play toward another defender, but I think that assumption is implicit in the term "playmaker" that Brian keeps going back to. It's interesting you bring up Revis, like he isn't given enough credit, even though he's #1 on the list... comparing CBs to LBs might be apples to oranges, but comparing a CB with other CBs probably gives a pretty good measure of ability. You can "intimidate" a QB into throwing away from you, but you still have to make the play when it goes your way, which is why Revis is so high: he's almost never beaten when he is challenged. I agree about Asomugha and Hall though - there should be a way to measure on a per-play basis and account for gamblers.
Really, this isn't much of a breakthrough, it's just an interesting stat that reinforces what we already know. Players make Pro Bowls because people know about them, because they're playmakers. Usually the guys with the gaudy stats - sacks and tackles and INTs - are also going to be the ones with the highest WPA+.
Check out profootballfocus.com, they watch the tape on each play and then score each player based on how they played. So this will include every play, including ones where we don't have any stats.
A comparison between your rankings and profootballfocus might be interesting, but I don't really know how accurate their scores are. They may undervalue things like an interception or overvalue things like a touchdown.
That said, here is how your top corners rank at ProFootballFocus:
Darelle Revis #2
Dominic Rodgers-Cromartie #4
DeAngelo Hall #76
Charles Woodson #1
Asante Samuel #36
Tracy Porter #37
Rhonde Barber #94
Champ Bailey #9
So you have three of their top 4 players but then a bunch of players in the 30's to 90's.
Like I said, I have no idea how accurate profootballfocus is but seeing DeAngelo Hall in your top 10 makes me immediately suspicious. I think that by throwing out bad plays and only including good ones you are rewarding gamblers who give up a lot of completions but produce a lot of interceptions. Now it's very possible that interceptions really are that valuable, but I watched a bunch of DeAngelo Hall and anything that puts him at #3 is suspcious :)
Btw, here are ProFootballFocus' top 10 cornerbacks, how did they rank on your cornerback list?:
1) Charles Woodson
2) Darelle Revis
3) Leon Hall
4) Dominique Rodgers-Cromartie
5) Brandon Flowers
6) Johnathan Joseph
7) Antwoin Winfield
8) Jabari Greer
9) Champ Bailey
10) Terrell Thomas
As for Nnambi Asomugha he's 17th overall but 3rd when I look at score/targets. He was only targeted 28 times on 980 plays he was out there. People weren't even trying to challenge him most of the time. However, unlike Derrelle Revis, he doesn't line up on the opponents best WR all the time, so opposing QB's just target the Raider's other cornerbacks (Chris Johnson, the Raiders #2 corner had 100 targets and Sanford Route, #3, had 41).
Using the same reasoning I would like to see +WPA and +EPA for running backs also. When a RB gets positive WPA or EPA he most likely did something very well. But when RB gets negative WPA/EPA, it propably was because the line missed a block or it was just a bad play call by the coach.
I just hate to see players like Adrian Peterson and Steven Jackson ranked so low.
Brian,
why are +WPA and -WPA not used for offensive players
There's no reason not to. It's a simple enough calculation to do. I just don't have enough column space to display all the possible stats. Defenders present a special challenge because of the reasons in the main post, and total EPA/WPA isn't meaningful for them.
I can across your site,via ESPN. I have to say WOW you guys are doing a fantastic job and all this data.
Brian, have you considered a statistic like "Targets Below Average" to help with +EPA for a corner? Say Revis marks up on Calvin Johnson one game. Revis' "TBA" stat for that game will be how many targets Johnson normally gets minus what he got that game. If I know what Calvin averages 0.5 EPA per target, and Revis prevented 5 targets compared to the average that game, we can credit Revis with +2.5 EPA simply for the targets Johnson didn't get. Maybe the average EPA per target doesn't have to be player-specific, but rather league-wide (but TBA has to be player-specific every game). This seems like an upgrade for assessing corners with +EPA.
I was bored, and looking back through old ANS posts, and came across this. I think we can measure overall wpa/epa from team defenses. I'd be interested to see how much impact +wpa/epa has on team wpa/epa. I think there could also be tremendous value in using regression on play-by-play stats to see what makes a team defense better, and who knows, you might find some high correlations. Additionally, in every sport defense is hard to quantify. Applying baseball's range factor in the form of tackle factor is great, but its limitations are obvious. I think the best solution is using film data, like basketball has done. It would certainly be quite an endeavor to collect, but it could tell us a lot more than play-by-play stats.