
 In my recent post about NBA and NFL home advantage I made the contention that the importance of home field advantage (HFA) increases when opponents are more evenly matched. I said this based on the results of this study, which looked at the importance of various factors in the playoffs. Because playoff games are relatively rare and offer a small sample size, I decided to look at regular season games that featured two playoff-caliber opponents in order to expand the data set. I noticed that home field advantage appeared stronger in games that featured "good vs good" teams or "bad vs. bad" teams compared to games that featured "good vs bad" match-ups.
Some commenters were understandably skeptical, so I dug a little deeper. I looked at all NFL regular season games from the 2002 through 2006 seasons (a total of 1280 games) and it turns out the effect appears real but not extremely consistent.
The graph below plots home team win percentage against season win total difference. For example, if a game featured a team that would eventually go 12-4 against a team that would end up 8-8, the season win total difference would be 4. As the gap between the relative strength of the opponents increases, HFA shrinks. For teams that end up with the same record, the home field advantage is relatively strong at 63% compared to an overall average of 57%.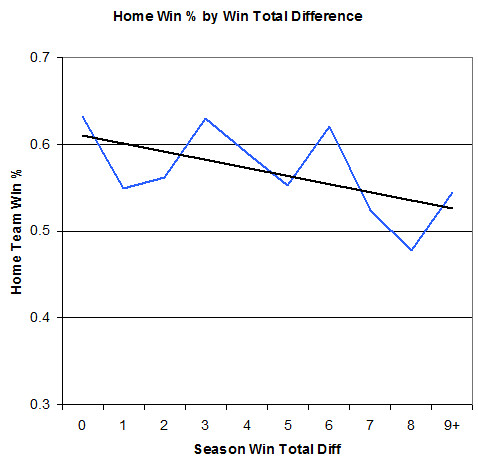
Admittedly, the effect is not consistently smooth, which suggests there is a good deal of randomness involved. But the trend is fairly clear and it is consistent with what we observe in playoff games, not only in the NFL but the NBA as well.
On the other hand, if we accept the smoothed line, HFA ranges from 61% for evenly matched games down to 53% for mismatches. On the surface 8% doesn't seem very strong, but think of it this way: the effect of HFA ranges from +11% to +3%, a several-fold difference.
NFL Home Field Advantage and Team Strength
Bias and Home Advantage in the NBA vs. NFL
 Recent attention has been focused on possible referee bias in the NBA. Former official Tim Donaghy, who is due to be sentenced for crimes related to fixing games, made allegations that officiating bias is common. The most damning accusation is that the NBA attempts to prolong playoff series by calling fouls more heavily on the team that is “up” in the series.
An article by Kevin Hasset, an economist and policy analyst for the American Enterprise Institute, points to apparent irregularities which he says could be evidence for NBA bias. Exhibit A is a large increase in home court advantage (HCA) from the regular season (60%) to the playoffs (74%). Exhibit B is the large discrepancy in fouls called against visiting teams compared to home teams. The author also points to suspicious examples where the difference in fouls and shooting percentage served to extend playoff series.
These results, however, are exactly what we should expect in a fair system. The explanation is due to how HCA affects different match-ups and the true cause and effect relationship between fouling and winning.
Home Field Advantage in the NFL
In the NFL, home field advantage (HFA) also increases from the regular season to the playoffs even though the league’s single-game playoff format provides no incentive to prolong a series. One big reason for the difference is due to the relative strength of opponents.
The NFL’s regular season HFA is 57%--the home team wins 57 out of 100 times. But in the playoffs it’s 68%. The biggest difference between regular season games and playoff games is the relative strength of opponents. Regular season games can feature mismatches, but playoff games feature only opponents who are relatively close in ability.
When teams are well-matched in ability, other factors such as HFA, which are normally small, appear more decisive. There are fewer cases of games that feature a strong visitor against a weak home team in the playoffs. The winning percentage of the home team would therefore naturally increase.
Home Court Advantage in the NBA
In the NBA, HCA is even stronger than the NFL’s HFA. Think of home advantage not as a game-long effect, but as a tiny advantage on each possession. The NBA plays quickly with a short shot clock and long 48 minute games. It’s a sport on speed. Each team gets about 100 possessions per game. Over the course of each possession, a HCA effect accrues into a very large game-long effect. HCA in the NBA is unusually strong for natural reasons having nothing to do with bias.
In the NBA playoffs, HCA is magnified by the same process at work in the NFL. Teams are closer in ability, and therefore other factors such as HCA appear to be more decisive.
Foul Calls and Home Court Advantage
Observers suspicious of NBA bias point to the fact that home teams are called for far fewer fouls than visiting teams. The correlation between numbers of called fouls and winning for the home team is quite clear. The natural conclusion would be that referees call more fouls on visitors --> therefore home teams tend to win. But I don’t think the direction of causation is clear at all. If HCA is natural and not due to officiating bias, we’d still see the same results. Teams that are behind foul frequently toward the ends of games as a strategy. Losing teams know their best chance to win is to prevent their opponents from dribbling out the clock, and hope they miss a large number of free throws. In this respect, losing leads to fouling as least as much as fouling leads to losing. Even if referees were completely fair, we’d still see a disproportionate number of fouls called on visiting teams because visiting teams tend to be behind. The fouling effect would appear especially strong in the playoffs because HCA is especially strong.
This effect would also distort other stats such as shooting percentage. Teams that are behind would wisely take greater risks including taking more 3-point shots and playing a faster tempo. Over the long run this will depress their shooting percentage, but it’s the right strategy for the situation at hand.
Extending Series
Due to the format of the NBA’s 7-game playoff series, HCA will cause the illusion that referees are favoring the extension of a series. The NBA has changed its playoff formats slightly in recent years, but each format would roughly have the same effect. Currently, playoff series alternate home court this way: HH AA H A H. The finals are slightly different. That series goes: HH AAA HH. For every finals series however, there are 14 “regular” playoff series, so that format would dominate any study.
The 2-2-1-1-1 format would naturally give the appearance of favoring the extension of the series, even if referees were completely fair. Given that HCA is strong (74%) and normal (not due to bias), the most likely scenario is to have a 2-2 tie after game 4. In this case, the 5th game would probably be won by the home team. Game 6 goes to the home court of the team trailing 2-3 who will probably win. This extends the game to game 7. The next two most likely scenarios are a 3-1 advantage going into game 5. Sometimes game 5 will be at the 3-win team’s home court, and sometimes it will be at the 1-win team’s home court. Given the 74% playoff win rate of the home team, at least half of these scenarios would therefore give the appearance of extending the series. (I say at least half because 3-1 advantages tend to go to stronger teams, which tend to start a series with home court.) So out of the 3 most likely scenarios, 2 tend to give the appearance of extending a series. The third “non-extending” situation is actually the least likely of the three. The only remaining scenario, the 4-0 sweep, is very rare.
Further, games in which the home team wins (and extends a series) would also naturally have more fouls called on the loser. This makes NBA officiating look all that more suspicious.
Whatever the reason, home advantage is real in all sports. It exists even when there are no incentives for a league to prolong competition, such as NCAA basketball or other pro sports. Basketball is particularly susceptible to accusations of bias at all levels due to its high frequency and subjectivity of foul calling. Referee judgment is heavily involved in determining outcomes. To be honest, I wouldn’t be surprised if the NBA did somehow tilt things in the interest of better TV ratings. But the evidence needs to be completely understood before we can make any conclusions.
A follow up on the NFL's HFA and team strength here.
Phil Birnbaum's take here.
Addendum: Here is a plot of NBA regular season home team win percentage according to the difference in opponent season wins.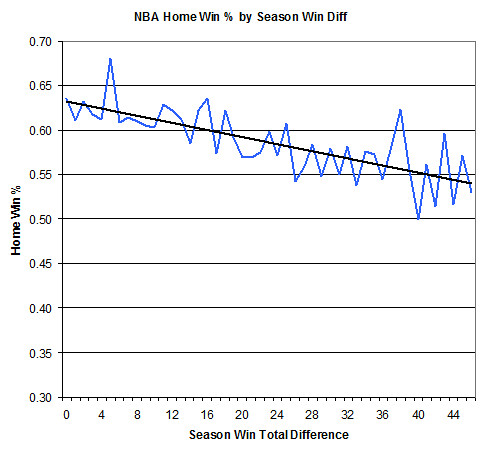 As the difference in team strength increases HCA decreases. However, even at a difference of zero wins, HCA tops out at 64%, short of the 72% in the playoffs over the past two seasons. But over the span of 1996 through 2007, the HCA in the playoffs was 67%. So there may be something special about the playoffs that increases HCA. Sold-out arenas, national attention, and intensity might explain the difference. There may be one more reason too. The stronger (higher seeded) teams get more home games in the playoffs due to the 2-2-1-1-1 format, so there could be some significant covariance between relative team strength and HCA.
Game Theory and Great Running Backs
 Should a team that adds a superstar running back run more often? It seems like a dumb question, but the answer isn't so simple.
In 2006 the Minnesota Vikings ran the ball 388 times for 1820 yards, a 4.1 yard per attempt average. In 2007 the Vikings added rookie sensation Adrian Peterson who helped the Vikings run 440 times for 2634, a 5.3 yard per attempt average. That's an increase of 52 runs from '06 to '07, a 13% increase. (Rush attempt figures do not include QB runs or kneel-downs).
Part of the increase might have been due to the Vikings ' two more wins in '07 than in '06. Since running is a safer option late in games with leads, we could expect a few additional run attempts, but certainly not 52. With the addition of a star RB like Peterson, should a team like the Vikings have run even more? Or did they run too much?
Conventional wisdom might say of course. Why wouldn't a team use its biggest advantage more frequently? But think about it from the point of view of an opposing defense. They know how big a threat Peterson is, and would likely orient their strategy toward stopping the run. Knowing this, what should the offense do? There are 3 options:
1. Run more often than before because every run will bring an increased payoff.
2. Pass more often because the defense will be stacking the line with run defenders.
3. Run the same proportion as before. Considerations 1 and 2 balance out, and payoffs will increase for both passing and running.
From my recent article of game theory and strategy, recall this simple payoff matrix (below). An offensive run play against a run defense will usually result in a setback. But against a pass defense it will be more successful. Similarly, a pass against a run defense is likely to be more successful. The payoffs don't necessarily represent yards or points, but rather a proportional preference for the various expected outcomes.Before star RB Defense Run D Pass D Blitz Offense Run -3 4 6 Pass 9 -3 -5
Now let's add a star RB to our team. Let's say our expected run outcomes increase by 1 full unit against each defensive strategy. Our passing outcomes remain unchanged. The new payoff matrix looks like this:With star RB Defense Run D Pass D Blitz Offense Run -2 5 7 Pass 9 -3 -5
How would this change affect the optimum run/pass balance for the offense? The original payoff matrix is illustrated in the chart below. The x-axis represents the run/pass mix of the offense. The left side of the chart indicates the payoffs vs. the defensive strategies if the offense runs 100% of the time, and the right side of the chart indicates the payoffs if the offense passes 100% of the time. In between are the payoffs given various proportions of running and passing.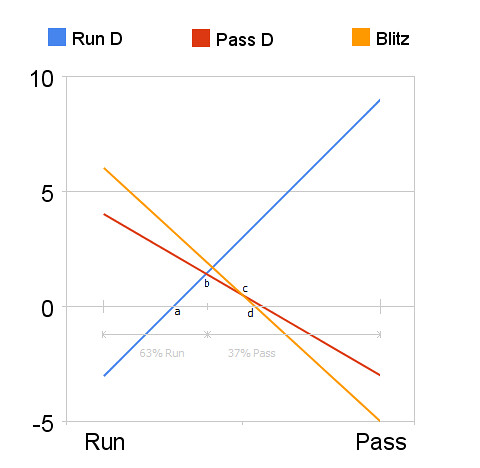 The optimum play mix, where the payoff to the offense is maximized, is the intersection of the red and blue lines at point b. In the example (before adding the star RB), the offense should run 63% of the time and pass 37%. As long as the offense optimizes, the blitz (orange) strategy is not part of the defense's optimum strategy mix. We can ignore it for now.
Graphically, when an offense's run performance increases, the payoffs on the left side of the chart move upward. The payoffs on the right side of the chart (the passing payoffs) stay fixed. In effect, we get a hinged upward swing of all the payoff functions. As run performance increases, notice what happens to the optimum play mix (the intersections). The optimum ratio of running and passing remains constant. Running yields bigger payoffs, but defenses would have to adjust, allowing the passing game to face run defenses more often. In the example where we added 1 unit of payoff to every run play, the intersection is where yRUN D= yPASS D. Therefore:
-2 + 11x = 5 -8x
19x = 7
x = 7/19 = 0.37
Did the Vikings run too often? Who knows. In theory, all things being equal, the addition of a superstar RB shouldn't alter an offense's play selection. The passing game should open up, and the offense will improve overall. In fact, that's what happened to the Vikings between '06 and '07. With a very shaky Tavaris Jackson under center, they still improved from 5.4 net yards per pass attempt to 5.8 after adding Peterson.
So if the relative strengths of the offense doesn't affect the theoretical optimum run/pass balance, what does? Increasing pass performance would just lead to the same balance. The graph would be hinged on the left instead of the right, but the optimum proportion would remain constant. The result is the same when the defense improves or worsens. Oddly, the only way to achieve a shift of the optimum run/pass balance is for either or both offensive strategies to improve against one of the opponent strategies but not the other. For example, the optimum balance would shift toward the pass if an offense improved both their run and pass performance against a run defense without improving against the pass defense. Confused? Perhaps you should be--such a scenario would be hard to imagine. How would a team's running or passing improve against a run defense but not a pass defense?
Admittedly, this is a highly theoretical analysis. In reality play selection has much more to do with game situations than anything else. But the analysis does explain why teams with apparently vastly different passing and running abilities all tend to share similar run/pass proportions. With rare exceptions, teams stick very closely to the NFL average 45% run proportion regardless of how their running game compares to their passing game.
Game Theory and Run/Pass Balance
 Previous research on the balance between running and passing in the NFL has largely missed the mark because it has focused on only half of the equation. Opposing defenses have been ignored. In this article, I'll illustrate how game theory can be applied to football play calling, and how it explains the balance between various strategies.
The research to date, notably the Alamar and Rockerbie papers along with my own articles, typically follow the same approach. They calculate the average expected yardage gain by running and by passing, accounting for various risks such as incompletions, turnovers, or sacks. The difference between the average expected gains for running and passing is then presented as a puzzle. If for example, passing yields a higher average gain than running, why don’t teams pass more often?
Further, if passing is far preferable to running, why should a team run at all? Hopefully that's obvious. An opposing defense could exclusively focus on defending the pass, dramatically limiting any expected gain.
 Yet the better play choice remains the pass. So I should pass more often than run, right? But the defense knows this too, so I know he'll certainly play a pass defense. Therefore, I should run. But he knows I know that he knows that...and around we go. This is where game theory comes in. Game theory can actually quantify the optimum mix of strategies mathematically.
Offenses in the NFL do not consist of simple run or pass decisions. In reality there are a myriad of formations, plays, and variations available as options. Likewise, defenses have a similar number of alternatives. But for now, just to illustrate the potential for game theory to help understand play calling, let's limit offenses to two strategies: the run and the pass. Defenses are limited to three: run defense, pass defense, and the blitz.
The example below represents a single NFL play as a "game." The number in each cell is the offense's "utility" given the combination of offensive and defensive strategy employed. The utility is not necessarily the yardage gained or expected points, but simply a proportionate scale of how preferred an expected outcome is to the others. And since football is a zero-sum game, the defense's utility is always the negative of the offense's.
| Defense | ||||
| Run D | Pass D | Blitz | ||
| Offense | Run | -3 | 4 | 6 |
| Pass | 9 | -3 | -5 | |
For example, if the offense chooses a run play and the defense chooses a run defense, then the outcome would be "-3" to the offense. This doesn't mean the offense would always lose 3 yards on such a play, but that the outcome is typically a setback, say a gain of only 2 yards or less. The utility to the defense would be +3 because what's bad for the offense is equally good for the defense.
 In this example a run play against a pass defense yields a positive result of 4 units. A pass against a run defense yields an even larger payoff of 9. A blitz against a pass play could set the offense back by -5 units. But the blitz is risky because if the offense had called for a run, it would likely be fairly successful. Each strategy option for both the offense and defense has its advantages, disadvantages, and risks based on which strategy the opponent has chosen.
From the offense's point of view, it appears that running is the safer bet. Two of the three possible outcomes are positive, and the worst possible outcome is no worse than -3. Passing has the highest possible payoff, but two of the three outcomes are negative. There is no clear-cut "dominant" strategy choice for the offense.
The best approach is to unpredictably sometimes run and sometimes pass, which game theory calls a mixed strategy. This is also what we see in reality. In fact, game theory methods can actually "solve" the game, providing the optimum proportion of running and passing. The solution is what's known as a Nash equilibrium, named after the mathematician made famous by the movie A Beautiful Mind. The Nash equilibrium is the mix of strategies where each opponent, knowing the strategies of the other, has nothing to gain by changing his own strategy. In other words, an offense is choosing the best proportion of play calls taking into account the defense's strategy mix, and the defense is choosing its best proportion of strategies knowing the offense's strategy mix.
 On the football field, the equilibrium point is found by trial and error. Countless plays are recorded and remembered along with corresponding opponent tendencies. Coaches tend to find the optimum mix of plays subjectively based on a combination of experience, intuition, and tradition. Game theory, however, can provide the true optimum mix of strategies, assuming the strategy choices are clear and their outcome distributions are known.
Recalling the example strategy matrix above, let's look at how a mix of running and passing would fare against a single defensive strategy. According to our example, if a defense always blitzed and the offense ran 100% of the time its expected utility would be +6 for every play. And if the offense passed 100% of the time its expected utility would be -5. We can plot those two points on a graph, and because we've defined utility as a linear function of preference, we can also draw a straight line between them (below). This line represents the expected utility of a given offensive strategy mix, from 100% run on the left to 100% pass on the right.
 If the blitz were the only strategy choice for the defense, then the offense's solution would be obvious. It should run 100% of the time, and it would expect a +6 payoff each play. But the defense has other options. The chart below adds the run defense and the pass defense as potential strategies.
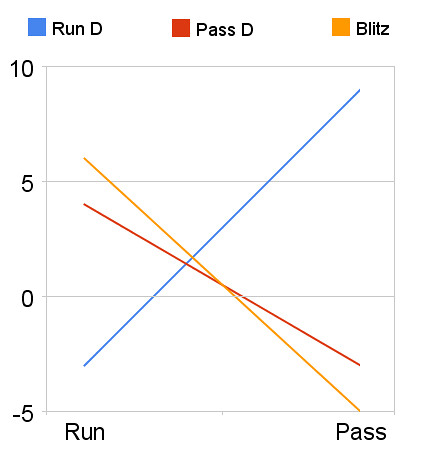 This chart of all possible strategies reveals the optimum strategy mix for both the offense and defense. Notice how the resulting plot forms a 'tee pee' shape between the y=0 line and the intersections of the defense strategy lines. This is where the offense's optimum strategy mix lies.
Think of the chart from the defense's perspective. The defense can hold the offense down to at most y by choosing a certain strategy or strategy mix. From the offense's perspective, it can maximize its payoff by selecting a mix of strategies at x. The version of the chart below identifies the solution.
To recap, the x-axis is a proportion of running and passing by the offense, from 100% running on the left to 100% passing on the right. The y-axis is the payoff to the offense based on the strategy mix of the defense.
To have any positive outcome, the offense needs to select a pass/run proportion somewhere between point a and point d. To maximize its utility, it should select the proportion at point b. (Keep in mind that the left side of the chart represents 100% run, so the fact that point b is closer to the left than the right indicates the offense should run more often than pass.)Similarly, the defense should choose a mix of run defense (blue) and pass defense (red). The blitz strategy does not intersect at the offense's optimum (point b), so it plays no part in the defense's optimum solution assuming the offense optimizes. If the defense were to mix in some blitzes, the offense would be able to increase its expected utility to somewhere above point b. Only when the defense believes that a pass is more likely than at point c should it consider blitzing.
Further, we can use algebra to compute the equilibrium point. We know that the equilibrium lies at the intersection of the run defense and pass defense lines. They can be described as follows:
pass defense: yPASS D = 4 - 7x
At the equilibrium (point b), yRUN D= yPASS D. Therefore:
19x = 7
x = 7/19 = 0.37
Given the example, the offense should pass 37% of the time and run 63% of the time. Knowing this, we can also find the expected utility at the equilibrium point using either of the relevant defensive strategy lines. I'll use the run defense line:
y = -3 + 12(0.37)
y = 1.4
The point at which the defense should begin to blitz (point c) is where the pass defense line and the blitz defense line intersect.
blitz: yBLITZ = 6 -11x
yPASS = yBLITZ
4 - 7x = 6 -11x
4x = 2
x = 2/4 = 0.5
Only when the offense's probability of passing is >= 50% should the defense blitz. We can find points a and b similarly by setting y = 0 for the run defense and blitz equations.
Even though the example here is artificial, the principles of game theory apply throughout every football game. Of course, offenses aren't limited to two play choices. Their playbooks are famously complex. And defenses are not limited to three options. In fact, they're not limited to any number. In reality a defense has an infinite continuum of biases between run and pass, from goal line defense to prevent defense and everything in between.
These problems are really only a matter of scale. The algorithms of game theory can solve games with large numbers of strategy options. It can even handle strategy sets like a defense's, without discrete "pure" strategies. Plus, the problem lends itself to great simplification because much of every offense's playbook is composed of subtle variations of a few virtually universal NFL plays.
 Application of game theory hinges on true measures of utility. The real difficulty in applying game theory to football on a practical level would be to develop a valid measure of the preferences of the various payoffs in the game matrix. Yards or points would seem like suitable measures, but a 3-yard gain is far more useful on 3rd and 2 than on 3rd and 9. And a 3-point field goal is fairly useless down by 7 late in the 4th quarter. In a forthcoming article I'll attempt to solve this problem with a proposed utility function for football.
But next, I'll look at what effect a star running back might have on offensive strategy. Should it pass more often or less often? How will the passing game's effectiveness change. How should a defense react? We have intuitive answers, but we'll see what John Nash says.
Game Theory Intro and 4th Down Decisions
 For a while I've been a proponent of more aggressive decision making on 4th down in the NFL. On this site and others, and in academic research such as the Romer paper, it's been shown that a team is usually better off going for it on 4th down, as long as it's not buried deep within its own territory or facing a very long 'to go.'
There are two possibilities here. Either most research on the subject is wrong, or NFL coaches are timid and more concerned with short term job security than winning. I've previously suggested the real answer may lie in decision theory, namely that the uncertainty surrounding such tactical decisions lead coaches to choose the option that promises the best worst case scenario rather than the option that provides the best chance of winning in the long run.
Although I still stand by that analysis, it may be only part of the story. Any tactical decision in football has to take into account the opponent. And this is exactly what game theory can do.
There are two kinds of games in game theory: zero-sum and non-zero-sum games. Zero-sum games are typically those in which the winner takes all. Whatever is good for me is equally bad for my opponent. In contrast, non-zero-sum games allow for "win-win" or "lose-lose" scenarios.
Football defines the zero-sum game at every level. At the end of 60 minutes, one team earns 100% of the W and the other eats the whole L. Even ties are zero-sum. Only in the most extremely bizarre scenario would a football game be non-zero sum, such as when a tie would qualify both opponents for the playoffs. And within each game, every single play represents a zero-sum "sub-game." Every yard gained by the offense is a yard given up by the defense. Football screams zero-sum.
But just as winning is a zero-sum proposition, scoring is not. A team could adopt a strategy that allows itself to score more often, but also allows its opponents to score slightly more too, hoping to gain the greater advantage. Mike Martz's Rams may have been an example of such a team. Their relative disregard for turnovers led to aggressive high-scoring outcomes, but it also allowed opponents to score more frequently themselves. The question is, on balance, does the strategy favor the more aggressive team itself or its opponents?
Consider a football game between two equally matched teams, Team A and Team B. Each team has the choice of two strategies: either the conventional punt strategy or an aggressive go-for-it on 4th down strategy. Assuming the research on 4th down strategies is correct, the possible outcomes of the game are listed in the table below. In terms of the probability of winning, when both teams employ the conventional punt strategy they each have a .5 probability of winning. Similarly, if both teams employ the go-for-it strategy they would also have equal chances to win. But if one were to adopt the go-for-it strategy and the other did not, the aggressive team would enjoy a .6 to .4 advantage in its probability of winning. (The table can be read [outcome for Team A, outcome for Team B].
| Team B | |||
| Punt | Go For It | ||
| Team A | Punt | .5, .5 | .4, .6 |
| Go For It | .6, .4 | .5, .5 | |
If the research is correct, and coaches were purely rational, they would adopt the more aggressive strategy on 4th down. But they don't, and part of the reason my be related to how coaches think of outcomes.
Coaches might sometimes confuse points for the ultimate outcome of interest--winning. There is a paradox at work. A strategy that ultimately allows an opponent to score more points may actually be superior in terms of winning. But because in every other respect football is zero-sum, a coach would naturally be averse to any strategy (more aggressive than the conventional status quo) that allows his opponent to score more, even if it theoretically improved his team's chances to win. After all, if scoring is good for my opponent, how could it be good for me?
Here is the same football game from the table above, but this time the outcome is described in terms of points scored instead of win probability. As you can see, the game now appears to be non-zero-sum.
| Team B | |||
| Punt | Go For It | ||
| Team A | Punt | 20, 20 | 24, 27 |
| Go For It | 27, 24 | 27, 27 | |
The average score in the NFL is about 20 points, so equally matched teams playing the conventional punting strategy could expect to average 20 points per game. The go-for-it strategy, according to the research, would allow the aggressive team to score more often--say 27 points per game. But it would also allow an opponent to score slightly more often--say 24 points per game.
If a coach is thinking in purely zero-sum terms, he would not be able to reconcile the non-zero-sum [27, 24] advantage with everything else he knows about the football.
Basketball has accepted this concept for years. NBA teams like the Phoenix Suns or Denver Nuggets employ fast-paced tempos that allow for more total possessions by both themselves and opponents. Consequently, they both score and allow more points per game. The idea is that their team strengths give them an advantage when playing at a quick pace. I think it might be particularly difficult to accept in football because of the zero-sum nature of yards gained and lost on every play.
 It's all in how you define your utility. Outcomes in game theory must adhere to strict rules such as linearity and transitivity to be valid. This is why previous research on run/pass balance has missed the mark. I'll illustrate exactly how and why in a forthcoming article. Plus, I'll propose a valid measure of utility in football.
Visualizing Team Stats
Click the play button and watch the churn of team records from year to year. Team wins are on the vertical axis and offensive pass efficiency is on the horizontal axis. Notice how strong the linear correlation is between passing and winning. Change the horizontal axis to offensive run efficiency and note how the correlation isn't nearly as strong.
In fact, play around with any of the parameters, including colors, circle sizes, etc. I've set up this motion chart with several "core" stats, including passing and running efficiency, and turnover rates. Click on a team (or several) to highlight it and follow it through the past 6 seasons.
A larger version is here.