
 In Decision Theory, there are generally two kinds of analysis. Descriptive analysis is what people actually do, and prescriptive analysis is what people should do. Rarely are the two things the same. For example, when I use the win probability model to evaluate 4th down decisions, I'm doing prescriptive analysis. Trying to explain whatever the heck coaches are actually doing would be descriptive analysis.
To be fair, coaches are not computers. They are subject to all the imperfections of human decision making. In this post, I'll examine some of the ways that coaches may be making decisions, including minimax, minimax-regret, prospect theory, and expected utility. I'll also discuss the potential for how much of a difference a pure prescriptive analysis can make when applied in real games.
NFL Orthodoxy
NFL football has evolved as extremely conservative game. By that I mean that coaches adhere to the wisdom passed down from previous generations and are reluctant to deviate from the established orthodoxy. In the real world, away from sports, this approach usually makes sense. Unlike sports, the world is not bounded by sidelines, end zones, and 15-minute quarters. It is highly uncertain and far less predictable than we'd like to think. It makes sense to adhere to what is known to work rather than try to engineer an optimized outcome in a highly uncertain environment.
But in football, we have the stats. We know the probabilities. And we know the possible consequences. 'Conservative,' as I defined it, is therefore often not the best approach. I think the reason that so many coaches adhere to the same orthodoxy, whether in terms of playbooks or 4th down doctrine, is because they aren't conscious of the level of certainty available to them.
Minimax
One of the more conservative approaches is the minimax criterion. Minimax says pick the option that assures you the highest minimum utility. Let's say you have the choice between going on a picnic and going bowling. You'd really rather go on the picnic, but it might rain. Your payoff matrix would look like this:
No Rain
Rain
Picnic 4 0 Bowling 1 1
If it doesn't rain, the picnic pays off, but if it rains you've lost the afternoon. Bowling is not as much fun as the picnic, but it wouldn't matter if it rains. Minimax says go bowling because 1 is its minimum payoff while 0 is the minimum payoff for the picnic.
Minimax-Regret
Another decision method is known as the minimax-regret criterion. This method seeks to minimize potential regrets. Imagine coming out of the bowling alley and being greeted by a sunny blue sky. 'Darn. Should have gone on the picnic.' In this case, if you go bowling and it doesn't rain, you've gained 1 unit of utility but lost out on 4 units, for a net regret of 3. If you go on the picnic and it does rain, you've gained 0 utility but lost out on 1 unit, for a net regret of 1. If you want to minimize your regret, you'd choose the picnic.
Notice that I haven't mentioned the weather forecast yet. These methods are best relied upon when there is a very high level of uncertainty in the "states of nature" that will determine the payoffs.
Now consider a football example. Say a coach has three plays that make sense for a given situation, and the opposing defense can call one of three kinds of defenses. An example payoff matrix might look something like this:
Def X
Def Y
Def Z
Play A
-4 4 12 Play B
-2 3 8 Play C
3 2 1
Note that this is not game theory. We're not looking for a Nash equilibrium. The offensive coordinator is thinking of the defense as a "state of nature." It's something he has no control over and is difficult to predict.
In this case, both Plays A and B have the possibility of negative payoffs. Play C guarantees at least a payoff of 1, and therefore would be the minimax decision.
The regret method says something different. Assume the defense had called Def X. The best payoff possible given Def X would be 3 with Play C, so had we called Play C there would be no regret. But had we called Play B, we would have earned a -2 payoff, which equates to a regret of -5. In other words, we could have had 3, but we got -2. And had we called Play A, we would have earned a -4, which is a regret of -7.
If we repeat the regret calculation for each possible defense, we get a whole new regret matrix:
Def X
Def Y
Def Z
Play A
-7 0
0 Play B
-5 -2
-4 Play C
0 -2 -11
Given this regret matrix, the minimax-regret criterion would look for the choice that assures us of the best worst-case scenario. For Play A, the worst regret is -7. For Play B, it is -5. And for Play C, it's -11. Therefore, we'd pick Play B because it is the least costly in terms of maximum possible regret.
Of course, coaches or anyone else would never actually draw up a matrix and do the math to make a decision. But just like in the picnic-bowling example, our brains are attempting poor analog versions of these kinds of decision criteria, and emotions play a large role.
Expected Utility
What if we reduce the uncertainty in the defense? We can't predict exactly which one we'll see, but we can estimate the probabilities that we can expect each defense. The expected utility of a choice is the weighted average of the possible payoffs. For simplicity, say each defense is equally likely with a 1 in 3 chance. Now we can estimate the expected utility for each play choice. In the example above, the expected utility for Play A is (1/3)(-4) + (1/3)(4) + (1/3)(12) = 4. The expected utility for Play B is 3, and for Play C it's 2. The expected utility method therefore says Play A is the best choice.
The three methods each call for a different decision. Each method is logical and consistent in its own way, but there is only one truly correct method in football, only one prescriptive analysis. Remember, in football we can know the probabilities and the payoffs, or at least have a solid league-wide baseline for them. The expected utility method is the only correct method.
The math behind expect utility analysis couldn't be any easier. It's 5th grade arithmetic. The challenge is knowing the utility function. Yards, and even points, don't equate to utility. A 7-yard gain is usually good, but it's relatively useless on 3rd and 8. And a 3-point field goal doesn't help late in the 4th quarter when down by 7.
Fortunately, there is win probability (WP). WP is the one and only correct utility function for any game, including football. Winning is all that matters, whether by 1 point or 100 points. WP is also perfectly linear, which is essential to valid expected utility analysis. A 0.40 WP is exactly twice as good as a 0.20 WP, and 0.80 WP is twice as good as 0.40 WP.
Prospect Theory
But even if coaches were to somehow use expected WP analysis when making decisions (say by using 'quick reference' cards like they sometimes do for 2-point conversion decisions), it's likely they still wouldn't be very rational.
Prospect theory says that people fear losses more than they value equivalent gains. Humans evolved with a tendency to try to avoid loss. We're usually more upset with ourselves when we misplace a $20 bill than we are happy when one falls out of the laundry. This tendency has been borne out time and time again in clinical experiments and other studies.
In football, this means that decisions are warped because coaches would fear a loss in WP more than an equivalent gain in WP. The chart below illustrates this concept. According to prospect theory, the "joy" from a 0.05 gain in WP is less than the "pain" from a 0.05 loss in WP.

This asymmetry would affect tactical decisions in many ways, but the most obvious may be 4th down doctrine. Say a team finds itself in a situation where punting would result in a 0.50 WP, but the expected utility analysis says going for the conversion would result in a net 0.55 WP. If the goal is to win the game, the correct decision in this case is to go for it. Period.
The analysis isn't so straightforward for the coach (even if he could do all the math on the spot). Say the failed conversion results in a 0.45 WP and the successful conversion results in a 0.65 WP. A 50% chance at successful 4th down conversion therefore results in a net 0.55 WP.
But the coach sees the 0.45 WP as a possible loss of 0.05 WP, and he sees the 0.65 as a gain of 0.15 WP. Because he fears the loss far more than he values the potential gain, even one 3 times as large, he'll prefer the sure-thing option and punt.
Further, it's possible to actually measure the risk aversion of coaches by comparing the WP advantages in situations where they went for the conversion to the WP advatanges in situations where they forego the conversion attempt.
An Advantage
The coach who can resist this human tendency and make decisions based purely on expected utility will have an advantage. Just how big an advantage, no one can ever know. Actually, that's not true--I'll tell you right now. Just by following a pure expected utility analysis on 4th down, a coach would win an average of an extra 1.4 games per year.
I calculated this based on a play-by-play database from the past 9 seaons. For each 4th down in which a team kicked either a FG attempt or punt, I calculated the difference between going for it and kicking. Wherever the difference was positive, I summed the increase in WP for going for it. The grand total for nearly 2400 games was +203.1 WP, which equates to an increase of 0.17 WP for every game. But since there are always two teams competing in every game, this means that we need to halve that, which is 0.086. The bottom line is that a pure expected utility approach to 4th down decisions would increase a team's chances of winning a game from 0.50 WP to about 0.59 WP. This is equivalent to an extra 1.4 wins per season (0.086*16).
That's a bold claim, I realize. But if you trust my WP model, which is really nothing more than a smoothed empirical observation of how often teams actually won in given game situations in real NFL games, then the claim is not so bold. It's not a perfect model, but the errors are unbiased, meaning it overestimates as much as it underestimates.
Still, if a coach only followed the expected utility recommendations when the WP for going for it was greater than 0.05 more than the WP for kicking, his team would still benefit by an extra 0.8 wins per season. That's nothing to sneeze at in a 16-game season.
Decision Theory in Football
Recent Contributions
It can be an interesting exercise to answer questions for reporters and bloggers. Sometimes their questions get me thinking about things in ways I hadn't thought of, or questioning my own assumptions.
Here are a few recent articles from around the web that I've answered questions for:
Rotosavants.com asked me about injury predictions and why I'm so skeptical about them.
The Wall Street Journal did short blurb on how many dollars per wins Eli Manning's new contract might be worth.
Here is a really neat article by Sam Arbesman in the Boston Globe about the concept of clock management in football. As a thought exercise, Sam proposes the addition of a "Time In," which is essentially an anti-time out. It gets you thinking about how important every few seconds are in a close game. I'm kind of a fan of some of Sam's other articles too. My favorite is this one, a suggestion of how to gain immortality in the name of a mathematical constant.
Last month, I did a radio interview with a Chicago station about my Jay Cutler articles.
Koko Fantasy Rankings - Defense
 Last but not least are Koko the Monkey's team defense rankings. In case you aren't familiar with the Koko rankings, they are the simplest projections possible based on previous-year performance. These are intended to serve as the baseline for the bare-minimum accuracy we should expect from all other fantasy projections. A full explanation can be found in the write-up for the QB rankings.
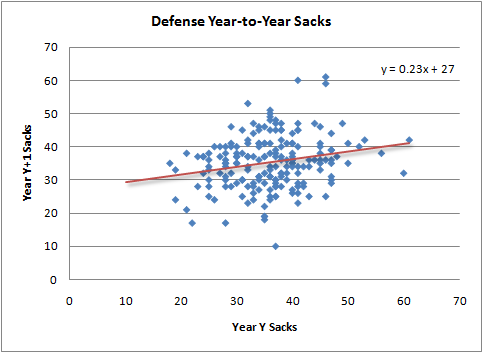
Defense point totals can vary widely depending on your league's scoring rules. For these rankings, I used turnovers, sacks, defensive TDs, and points allowed. Year-to-year correlations for turnovers and defensive TDs are extremely weak, but sacks and points allowed can be projected relatively well. I ignored special teams-based scoring, which should not have any effect on the rankings, as special teams stats are notoriously random and unpredictable.
Here are how sacks and points allowed regress in case anyone is curious.
Here are the final rankings. Regarding fantasy scoring for points allowed, every league is different. I didn't do the math required to estimate how many times a team with a given point average would fall into the various scoring "bins." Instead, I looked at my own league and saw they (very) roughly assign half a point for every point allowed below league-average, which is about 20 pts. So that's what I did here.Rank Defense Sks/G Ints/G Fum/G Pts Allwd/G TDs/G Pts/G Total 1 PIT 2.4 1.0 0.7 18.7 0.16 7.4 118.8 2 TEN 2.3 1.0 0.7 19.0 0.16 7.2 115.3 3 BAL 2.2 1.1 0.7 19.2 0.16 7.0 112.4 4 PHI 2.4 1.0 0.7 20.1 0.16 6.6 105.7 5 NYG 2.3 1.0 0.7 20.3 0.16 6.5 103.9 6 IND 2.1 1.0 0.7 20.3 0.16 6.3 100.0 7 MIA 2.3 1.0 0.7 20.8 0.16 6.2 99.6 8 WAS 2.0 1.0 0.7 20.3 0.16 6.2 98.6 9 NE 2.1 1.0 0.7 20.6 0.16 6.1 98.2 10 MIN 2.3 1.0 0.7 21.1 0.16 6.1 96.8 11 TB 2.1 1.0 0.7 20.9 0.16 6.1 96.8 12 CAR 2.2 1.0 0.7 21.0 0.16 6.0 95.7 13 ATL 2.2 1.0 0.7 20.9 0.16 6.0 95.3 14 DAL 2.5 1.0 0.7 21.8 0.16 5.9 93.7 15 NYJ 2.3 1.0 0.7 21.6 0.16 5.8 92.3 16 CHI 2.1 1.0 0.7 21.5 0.16 5.7 91.9 17 SD 2.1 1.0 0.7 21.4 0.16 5.7 91.1 18 BUF 2.0 1.0 0.7 21.3 0.16 5.6 90.1 19 CLE 1.9 1.0 0.7 21.5 0.16 5.6 89.6 20 JAX 2.1 1.0 0.7 21.8 0.16 5.5 87.5 21 GB 2.1 1.0 0.7 22.1 0.16 5.4 86.5 22 OAK 2.1 1.0 0.7 22.3 0.16 5.3 85.1 23 SF 2.1 1.0 0.7 22.1 0.16 5.3 85.1 24 CIN 1.9 1.0 0.7 21.8 0.16 5.3 85.1 25 SEA 2.2 1.0 0.7 22.4 0.16 5.2 83.8 26 NO 2.1 1.0 0.7 22.4 0.16 5.2 83.1 27 HOU 2.0 1.0 0.7 22.4 0.16 5.1 81.7 28 ARI 2.1 1.0 0.7 23.1 0.16 4.9 77.7 29 DEN 2.1 0.9 0.7 23.6 0.16 4.5 71.4 30 STL 2.1 1.0 0.7 24.0 0.16 4.4 70.6 31 KC 1.8 1.0 0.7 23.4 0.16 4.4 70.5 32 DET 2.1 0.9 0.7 25.1 0.16 3.8 60.0
Koko Fantasy Rankings - Kickers
 The rankings everyone's been waiting for--kickers. Koko the fantasy football monkey is making his way through each position. In case you aren't familiar with the Koko rankings, they are the simplest projections possible based on previous-year performance. The rankings are intended to serve as the baseline for the bare-minimum accuracy we should expect from all other fantasy projections. A full explanation can be found in the write-up for the QB rankings.
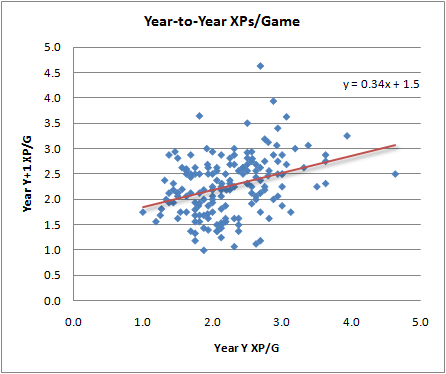
Kickers are highly unpredictable, both in real terms and in fantasy terms. In fact, there is no year-to-year correlation in the fantasy points gained by field goal kicking. But there is some consistency in extra points, which has nothing to do with kicking skill and everything to do with the rest of the kicker's team.
With that in mind, Koko has ranked his kickers based on XPs alone. The bottom line is that kickers are generally interchangeable. Treat the kicker as a position you'll want to swap out later in the year once you get an idea of who's kicking a lot of FGs. For example, look at which teams have good defenses but can't put the ball in the end zone.
One result of relying only on XPs is that we're only interested in team TDs. Therefore, if a kicker is replaced on a team, Koko's projection remains for new kicker on that team. For example, Steve Houshka is replacing Matt Stover in Baltimore. His projection is what Stover's would have been had he remained on the team. To be honest, I'm not closely watching kicker news, so if there are other examples, or if there are guys on here who will be on the IR or out of a job, let me know.Player XP/G FG Pts/G Pts/G Proj Pts John Kasay 2.5 5.2 7.7 115.1 Mason Crosby 2.5 5.2 7.7 115.1 Nate Kaeding 2.5 5.2 7.7 115.1 David Akers 2.5 5.2 7.7 114.8 Neil Rackers 2.4 5.2 7.6 114.5 Adam Vinatieri 2.4 5.2 7.6 114.2 Jason Elam 2.4 5.2 7.6 113.9 Nick Folk 2.4 5.2 7.6 113.9 Jay Feely 2.4 5.2 7.6 113.7 Steven Houshka 2.4 5.2 7.6 113.5 Robbie Gould 2.4 5.2 7.6 113.5 Garrett Hartley 2.4 5.2 7.6 113.4 Dan Carpenter 2.3 5.2 7.5 113.2 Rob Bironas 2.3 5.2 7.5 113.2 Ryan Longwell 2.3 5.2 7.5 113.2 Stephen Gostkowski 2.3 5.2 7.5 113.2 Matt Prater 2.3 5.2 7.5 112.9 Kris Brown 2.3 5.2 7.5 112.3 Jeff Reed 2.3 5.2 7.5 112.0 Matt Bryant 2.2 5.2 7.4 111.6 Joe Nedney 2.2 5.2 7.4 111.3 Rian Lindell 2.2 5.2 7.4 111.3 Josh Scobee 2.2 5.2 7.4 111.0 Olindo Mare 2.1 5.2 7.3 110.0 Jason Hanson 2.0 5.2 7.2 108.5 Sebastian Janikowski 2.0 5.2 7.2 108.5 Shaun Suisham 2.0 5.2 7.2 108.5 Josh Brown 1.9 5.2 7.1 106.5 Phil Dawson 1.9 5.2 7.1 106.2 Shayne Graham 1.9 5.2 7.1 106.0
Koko Fantasy Rankings - Tight Ends
 Tight ends are relatively easy to project. In addition to their steadily increasing prominence, the notable thing about TEs is how steep the fall-off is among the top several players. In case you aren't familiar with the Koko rankings, they are the simplest projections possible based on previous-year performance. The rankings are intended to serve as the baseline for the bare-minimum accuracy we should expect from all other fantasy projections. A full explanation can be found in the write-up for the QB rankings.
I'll cut right to the chase. Here are how tight end TDs per game and receiving yards per game regress. As you'd expect, yards are more consistent and predictable than TDs.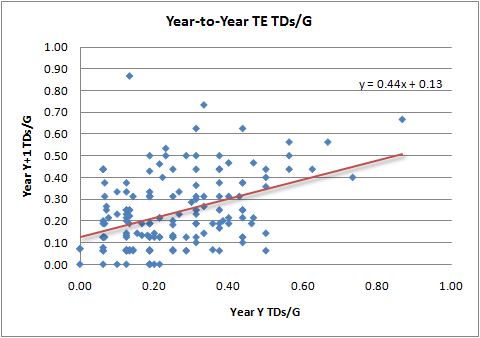

Fumbles are unpredictable, and hover at 0.2 fumbles per game. Top TEs tend to be relatively durable, and will play 14.5 games per year. Based on standard scoring of 6 points per TD, 1 point for 20 receiving yards, and -2 points for each fumble, here is how the projections stack up:Rank Player TD/G Yds/G Fum/G Pts/G Total Pts 1 Tony Gonzalez 0.40 57.6 0.2 4.9 70.7 2 Dallas Clark 0.30 50.5 0.2 3.9 57.0 3 Antonio Gates 0.34 41.2 0.2 3.7 54.1 4 Jason Witten 0.24 52.7 0.2 3.6 52.9 5 Visanthe Shiancoe 0.32 36.2 0.2 3.3 48.1 6 Tony Scheffler 0.23 45.4 0.2 3.2 46.8 7 Kellen Winslow 0.26 40.3 0.2 3.2 45.8 8 Owen Daniels 0.18 48.6 0.2 3.1 45.1 9 John Carlson 0.26 37.6 0.2 3.1 44.3 10 Anthony Fasano 0.32 29.6 0.2 3.0 43.3 11 Greg Olsen 0.26 35.2 0.2 2.9 42.5 12 Chris Cooley 0.15 48.0 0.2 2.9 42.3 13 Kevin Boss 0.30 27.5 0.2 2.8 40.3 14 Zach Miller 0.15 44.6 0.2 2.7 39.8 15 Heath Miller 0.22 35.8 0.2 2.7 39.2 16 Dustin Keller 0.21 33.3 0.2 2.5 36.4 17 Bo Scaife 0.18 34.6 0.2 2.4 34.9 18 Billy Miller 0.15 37.2 0.2 2.4 34.6 19 Daniel Graham 0.24 26.6 0.2 2.3 33.9 20 David Martin 0.21 29.4 0.2 2.3 33.6 21 Donald Lee 0.26 22.5 0.2 2.3 33.4 22 Jeremy Shockey 0.13 38.4 0.2 2.3 33.0 23 Marcedes Lewis 0.18 31.2 0.2 2.2 32.5 24 L.J. Smith 0.23 25.5 0.2 2.2 32.4 25 Jerramy Stevens 0.19 29.6 0.2 2.2 32.0 26 Todd Heap 0.21 27.2 0.2 2.2 32.0 27 Martellus Bennett 0.24 21.7 0.2 2.1 30.3 28 Alex Smith 0.22 21.8 0.2 2.0 29.1 29 Vernon Davis 0.18 25.1 0.2 1.9 28.1 30 Robert Royal 0.15 25.9 0.2 1.8 26.4 31 Desmond Clark 0.15 25.5 0.2 1.8 26.0 32 Benjamin Watson 0.19 19.6 0.2 1.7 24.7
Koko Fantasy Rankings - Running Backs
 Next up in Koko the monkey's fantasy rankings are the running backs. In case you aren't familiar with the Koko rankings, they are the simplest projections possible based on previous-year performance. The rankings are intended to serve as the baseline for the bare-minimum accuracy we should expect from all other fantasy projections. A full explanation can be found in the write-up for the QB rankings.
RBs are notoriously difficult to predict. While a starting QB can be expected to have the vast majority of his team's snaps, starting RBs often share snaps with backups. The dreaded RB-by-committee makes it difficult for a simple quantitative system to account for the varying expected number of carries each RB can get.
Still, the regression plots show us we can still project RB per-game production fairly well. I tried the projections two different ways. One way was to estimate production per run--yds per rush and TDs per rush--and then project the number of rushing attempts for each RB. The second method simply projected per game production--yds per game and TDs per game--without regard for the total number of carries. The two methods were equally accurate, so I chose the second, simpler method.
Ascent of the Tight End
 The Tight End position appears to be increasing in prominence in the passing game. Since 2001, TEs have been accumulating an increasing number of receiving yards, both in terms of total yards and in terms of the share of the overall receiving yards by all position types.
When I was going over the Koko fantasy projections for TEs, I noticed the trend illustrated in the graph below. TEs have been getting more receiving yards each year since 2001. Not a single year saw a decline, and the increase has been over 40% since the beginning of the nine-year period.
The increase from 2001-2002 can be partially explained by the expansion of the league by the addition of the Texans. However, the increase in that year exceeds the 1/31st increase we'd expect, and the increasing trend continues to be steady.
The increase is not simply due to an increase in overall passing yards as a whole. Receiving yards by wide receivers have held very steady and receiving yards by running backs have slightly declined during that span. The graph below shows the relative change in receiving yards by position compared to the 2001 baseline.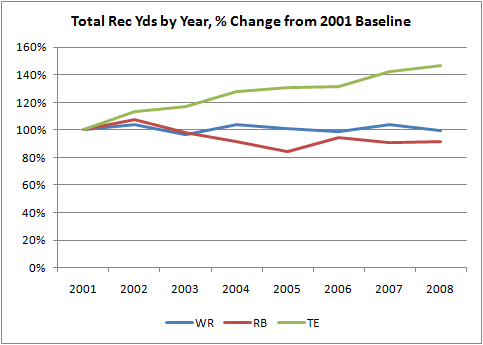 The decline in RB receiving yards is small and does not account for the increase in TE yards. In other words TEs are not robbing passes that used to go to RBs. The increase in TE yards are "new" yards. TEs eclipsed RBs in receiving yards for the first time in 2004, and have continued to hold a an edge ever since.
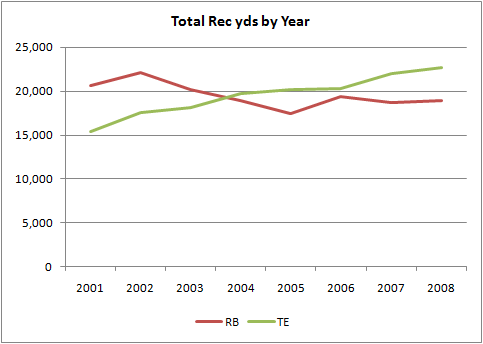
This isn't too surprising given the abundance of pass catching TEs around the league. Anyone following the game for the past 20 years has witnessed the evolution of the TE position. (And I suspect I may be retreading ground others have plowed.) Forty percent over nine years, however, is a stark increase. Could you imagine an equivalent change in baseball, say a 40% increase in hits by second basemen over nine years? It would be stunning.
The increase is far too large to be explained by a handful of outliers like Gonzalez, Heap, Clark, or Gates. It's due to a change in the league as a whole. I'm not sure when the trend began as my data only goes back to 2001. The PFR guys have data back to the dawn of time, and might be able to shed some light.
Koko WR Fantasy Projections
 Here is the next installment of the Koko The Monkey's fantasy football projections. Wide receivers are ranked based on a regression from last year's stats.
These projections are intended to be establish the baseline minimum accuracy of projections as the most reasonably naive predictions. The general explanation of the system can be found in the post ranking quarterbacks.
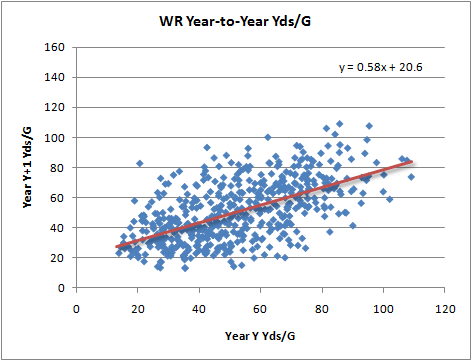
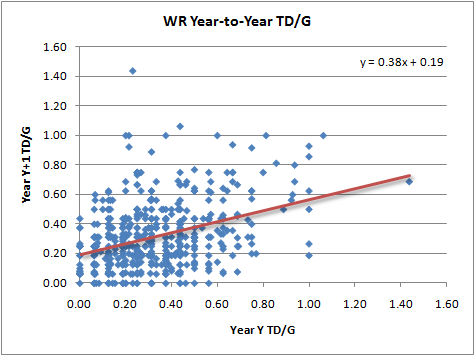
WR fantasy performance is far simpler than QB fantasy performance. Receiving yards and touchdowns are the only driving factors. Rushing or kick returning yards are ignored in these WR projections. Receiving yards and TDs appear to regress at similar rates from year to year, so these projected rankings will likely be a straight regurgitation of last year's end-of-year rankings.
I included WRs with at least 20 receptions in a season in the analysis. Depending on how high the cutoff, or which stat you use (yards, games, receptions), the regression rate is different. In the end however, the overall rankings aren't significantly affected, and the projected points are only slightly different.
Wide Receivers don't appear to have any consistency in terms of fumbles or injuries. They average 0.05 fumbles per game, with guys who get a lot of receptions obviously having more opportunities. WRs play in an average of 14.3 games in a season regardless of how many they played the year before.
I've removed Burress and Harrison, but I didn't spend much time looking through the list to find guys who may have retired or who may already be on the IR.
| Rank | Name | TDs | Yds | Fum | Pts/G | Proj Pts |
| 1 | Anquan Boldin | 0.54 | 71.1 | 0.07 | 6.6 | 95.0 |
| 2 | Larry Fitzgerald | 0.47 | 72.8 | 0.05 | 6.4 | 91.3 |
| 3 | Calvin Johnson | 0.47 | 69.2 | 0.06 | 6.2 | 88.5 |
| 4 | Andre Johnson | 0.38 | 78.1 | 0.05 | 6.1 | 87.0 |
| 5 | Steve Smith CAR | 0.35 | 79.9 | 0.05 | 6.0 | 85.6 |
| 6 | Greg Jennings | 0.40 | 67.8 | 0.05 | 5.7 | 81.7 |
| 7 | Roddy White | 0.36 | 71.1 | 0.05 | 5.6 | 80.0 |
| 8 | Randy Moss | 0.45 | 57.4 | 0.06 | 5.5 | 78.1 |
| 9 | Brandon Marshall | 0.34 | 69.8 | 0.06 | 5.4 | 77.5 |
| 10 | Terrell Owens | 0.43 | 59.0 | 0.05 | 5.4 | 77.4 |
| 11 | Antonio Bryant | 0.36 | 66.2 | 0.05 | 5.3 | 76.5 |
| 12 | Lance Moore | 0.43 | 54.5 | 0.05 | 5.2 | 74.3 |
| 13 | Marques Colston | 0.36 | 61.0 | 0.05 | 5.1 | 73.3 |
| 14 | Vincent Jackson | 0.36 | 60.7 | 0.05 | 5.1 | 72.6 |
| 15 | Reggie Wayne | 0.33 | 62.4 | 0.05 | 5.0 | 71.9 |
| 16 | Hines Ward | 0.36 | 58.7 | 0.05 | 5.0 | 71.1 |
| 17 | Dwayne Bowe | 0.36 | 57.9 | 0.05 | 4.9 | 70.7 |
| 18 | Kevin Walter | 0.38 | 53.4 | 0.05 | 4.9 | 69.5 |
| 19 | Bernard Berrian | 0.36 | 55.8 | 0.05 | 4.8 | 69.2 |
| 20 | Santana Moss | 0.33 | 58.7 | 0.05 | 4.8 | 69.2 |
| 21 | Justin Gage | 0.38 | 52.3 | 0.05 | 4.8 | 68.7 |
| 22 | Eddie Royal | 0.32 | 58.7 | 0.05 | 4.7 | 67.8 |
| 23 | Deion Branch | 0.38 | 50.7 | 0.05 | 4.7 | 67.5 |
| 24 | Derrick Mason | 0.31 | 58.5 | 0.05 | 4.7 | 66.8 |
| 25 | Donald Driver | 0.31 | 57.6 | 0.05 | 4.6 | 66.4 |
| 26 | Wes Welker | 0.26 | 63.1 | 0.05 | 4.6 | 66.2 |
| 27 | Laveranues Coles | 0.36 | 51.6 | 0.05 | 4.6 | 66.1 |
| 28 | Isaac Bruce | 0.36 | 51.1 | 0.05 | 4.6 | 65.8 |
| 29 | Muhsin Muhammad | 0.31 | 54.3 | 0.05 | 4.5 | 63.9 |
| 30 | T.J. Houshmandzadeh | 0.29 | 55.8 | 0.05 | 4.5 | 63.7 |
| 31 | Santonio Holmes | 0.32 | 52.6 | 0.05 | 4.4 | 63.3 |
| 32 | Lee Evans | 0.26 | 57.8 | 0.05 | 4.4 | 62.3 |
| 33 | Steve Breaston | 0.26 | 57.3 | 0.05 | 4.4 | 62.2 |
| 34 | Jerricho Cotchery | 0.31 | 51.9 | 0.05 | 4.3 | 62.1 |
| 35 | Matt Jones | 0.25 | 57.6 | 0.05 | 4.3 | 61.6 |
| 36 | Greg Camarillo | 0.26 | 53.1 | 0.05 | 4.1 | 59.0 |
| 37 | Braylon Edwards | 0.26 | 52.5 | 0.05 | 4.1 | 58.8 |
| 38 | DeSean Jackson | 0.24 | 53.9 | 0.05 | 4.0 | 57.6 |
| 39 | Chad Ochocinco | 0.31 | 44.8 | 0.05 | 4.0 | 57.2 |
| 40 | Torry Holt | 0.26 | 49.7 | 0.05 | 4.0 | 56.7 |
| 41 | Devery Henderson | 0.26 | 49.6 | 0.05 | 4.0 | 56.5 |
| 42 | Michael Jenkins | 0.26 | 49.0 | 0.05 | 3.9 | 56.2 |
| 43 | Anthony Gonzalez | 0.29 | 44.8 | 0.05 | 3.9 | 55.3 |
| 44 | Chris Chambers | 0.33 | 39.9 | 0.05 | 3.9 | 55.2 |
| 45 | Kevin Curtis | 0.28 | 45.9 | 0.05 | 3.9 | 55.2 |
| 46 | Donnie Avery | 0.27 | 46.8 | 0.05 | 3.9 | 55.1 |
| 47 | Malcom Floyd | 0.31 | 41.5 | 0.05 | 3.8 | 54.8 |
| 48 | Devin Hester | 0.27 | 46.5 | 0.05 | 3.8 | 54.7 |
| 49 | Ted Ginn Jr. | 0.24 | 49.5 | 0.06 | 3.8 | 54.2 |
| 50 | Mark Clayton | 0.26 | 46.0 | 0.05 | 3.8 | 54.1 |
| 51 | Antwaan Randle El | 0.29 | 42.3 | 0.05 | 3.7 | 53.5 |
| 52 | Amani Toomer | 0.29 | 41.8 | 0.05 | 3.7 | 53.0 |
| 53 | Nate Washington | 0.26 | 43.6 | 0.05 | 3.7 | 52.4 |
| 54 | Patrick Crayton | 0.29 | 40.7 | 0.05 | 3.7 | 52.2 |
| 55 | Josh Reed | 0.22 | 47.4 | 0.05 | 3.6 | 51.6 |
| 56 | Mark Bradley | 0.29 | 39.1 | 0.05 | 3.6 | 51.2 |
| 57 | Brandon Stokley | 0.27 | 41.2 | 0.05 | 3.6 | 51.1 |
| 58 | Dennis Northcutt | 0.25 | 43.3 | 0.05 | 3.5 | 50.6 |
| 59 | Bobby Wade | 0.24 | 44.1 | 0.05 | 3.5 | 50.5 |
| 60 | Bryant Johnson | 0.26 | 40.5 | 0.05 | 3.5 | 50.2 |
| 61 | Jerheme Urban | 0.29 | 37.0 | 0.05 | 3.5 | 49.7 |
| 62 | Brandon Lloyd | 0.26 | 39.9 | 0.05 | 3.5 | 49.6 |
| 63 | Domenik Hixon | 0.24 | 42.4 | 0.05 | 3.5 | 49.5 |
| 64 | Koren Robinson | 0.25 | 40.1 | 0.05 | 3.4 | 49.2 |
| 65 | Josh Morgan | 0.29 | 36.1 | 0.05 | 3.4 | 49.1 |
| 66 | Ike Hilliard | 0.29 | 36.1 | 0.05 | 3.4 | 48.9 |
| 67 | Hank Baskett | 0.27 | 37.7 | 0.05 | 3.4 | 48.5 |
| 68 | Roy Williams | 0.27 | 37.4 | 0.05 | 3.4 | 48.3 |
| 69 | Johnnie Lee Higgins | 0.29 | 34.0 | 0.05 | 3.3 | 47.5 |
| 70 | Steve Smith NYG | 0.22 | 41.3 | 0.05 | 3.3 | 47.0 |
| 71 | Davone Bess | 0.22 | 40.8 | 0.05 | 3.2 | 46.4 |
| 72 | Chansi Stuckey | 0.27 | 34.6 | 0.05 | 3.2 | 46.3 |
| 73 | Jabar Gaffney | 0.24 | 37.7 | 0.05 | 3.2 | 46.2 |
| 74 | Rashied Davis | 0.24 | 36.8 | 0.05 | 3.2 | 45.5 |
| 75 | Reggie Williams | 0.26 | 33.9 | 0.05 | 3.2 | 45.5 |
| 76 | Bobby Engram | 0.19 | 42.6 | 0.05 | 3.2 | 45.5 |
| 77 | Michael Clayton | 0.22 | 39.5 | 0.05 | 3.2 | 45.4 |
| 78 | Jason Avant | 0.24 | 35.3 | 0.05 | 3.1 | 44.7 |
| 79 | Arnaz Battle | 0.19 | 41.2 | 0.05 | 3.1 | 44.6 |
| 80 | James Jones | 0.23 | 36.6 | 0.05 | 3.1 | 44.6 |
| 81 | Shaun McDonald | 0.22 | 36.8 | 0.06 | 3.1 | 43.8 |
| 82 | Brandon Jones | 0.22 | 37.0 | 0.05 | 3.1 | 43.7 |
| 83 | Jordy Nelson | 0.24 | 34.0 | 0.05 | 3.0 | 43.5 |
| 84 | Dane Looker | 0.25 | 32.7 | 0.06 | 3.0 | 43.3 |
| 85 | Jason Hill | 0.24 | 32.2 | 0.05 | 2.9 | 42.1 |
| 86 | Justin McCareins | 0.19 | 37.8 | 0.06 | 2.9 | 41.9 |
| 87 | Harry Douglas | 0.22 | 32.3 | 0.05 | 2.8 | 40.3 |
| 88 | Roscoe Parrish | 0.22 | 31.0 | 0.05 | 2.8 | 39.8 |
| 89 | Antonio Chatman | 0.19 | 31.9 | 0.05 | 2.6 | 37.8 |
| 90 | Brian Finneran | 0.22 | 26.8 | 0.05 | 2.5 | 36.2 |