
As always, these numbers come courtesy of Chris Cox at NFL-forecast.com and are generated with the help of his NFL-Forecast software app, which uses the win probabilities generated by the team efficiency model to create a Monte Carlo season simulation. And if you don't buy the game probabilities from Advanced NFL Stats, you can tweak them as much as you like to generate your own playoff projections. I encourage everyone to download the app and test out your own scenarios.
Playoff Projections - Week 13
published on 11/29/2012
with
4
comments
Weekly Game Probabilities
 Game probabilities for week 13 are up at the New York Times' Fifth Down.
This week make a cursory comparison between the 49ers' Colin Kaepernick and Alex Smith.
published on 11/29/2012
with
7
comments
Team Efficiency Rankings - Week 13

I discussed CAR last week. The other glaring difference between these rankings and other rankings is BAL. They're 19th in terms of opponent-adjusted efficiency. It's easy to see why in the second table below. Their 9-2 record is largely due to some very good fortune in some high leverage situations, as we witnessed last Sunday. My system here is basically saying they're an average team that's faced a relatively weak schedule so far. If you flip a coin 11 times, it will come up at least 9 heads rarely enough that I'm convinced they are probably significantly better than their efficiency numbers indicate.
The biggest difference between this system and others is that it heavily regresses turnovers. Turnovers of all kinds are extremely random, even for the best and worst quarterbacks and teams. The one category BAL exceeds in is offensive turnovers. While it may be true that the overwhelming majority of teams do not maintain consistent turnover rates, there can be exceptions. Because I follow BAL closely, I see how this might be the case for them. The bulk of offensive turnovers are by the quarterback--interceptions obviously, but they are the prime fumblers as well. Joe Flacco seems happy to accept an overthrow to the sideline on 3rd down or give in to the pass rush while protecting the ball. It can be frustrating to fans, but it may be working for the Ravens. Throughout his career, Flacco's WPA has significantly exceeded his EPA, and that's the case again this season. He's had a few game winning drives over the years, but a lot of that extra WPA comes from playing situational football--taking the smart sack or throwing the ball away when a turnover would be exceptionally damaging. As with most things, the truth is probably in the middle. It may be that part of their consistently low turnover rate is good luck, and part of it is by design.
Here are the efficiency rankings for week 13. Click on the table headers to sort. Raw efficiency data is in the second table below.
published on 11/27/2012
with
37
comments
Fourth Downs in the New Overtime: First Possession

1. The initial drive of the first possession (A TD wins, a turnover or punt triggers Sudden Death (SD), and a FG triggers State 2.)
2. The team down by 3 now has one possession to match the FG (triggering SD) or score a TD to win.
3. Sudden Death
The possibilities are illustrated in the event tree below, along with some back-of-the-napkin transition probabilities I made back when the new rules were first proposed. (State 1 is "1st Poss". State 2 is the branch under "2nd Poss" that follows a FG in the 1st Poss. Sudden death is self-explanatory and occurs after a no-score in the 1st Poss or after a FG is matched in the 2nd Poss.)
published on 11/27/2012
with
20
comments
Sunday's Numbers Have Been Crunched

published on 11/26/2012
with
4
comments
Niners Nine-Minute Drive
 Up 28-21 with the ball nearing the end of the third quarter, the Niners had a 78% of winning the game over the streaking Saints. That 78% does not account for the prolific Saints offense, though. What followed was a nine-and-a-half minute drive, lasting deep into the fourth quarter, draining precious time that Drew Brees would need in order to make a comeback. Any Saints fan -- or someone whose fantasy team depends on the Saints offense like myself -- could not have been more frustrated watching the Niners rumble down the field over the course of 17 plays and 85 yards.
Let's take a look at the evolution of the drive using our Markov model:

published on 11/26/2012
with
5
comments
One Play Remaining before the Half on the Goal Line

Let's set aside the score and look at the general case. It's a special situation because there is no subsequent kickoff. Instead of being worth 2.7 Expected Points (EP), a FG is worth a full 3 EP. And a TD would be worth a full 7 EP instead of 6.7. The offense would take the full value of the score.
The expected value of each choice is straightforward. It's just the probability of success * the value of the score. In the case of the FG it would be:
published on 11/25/2012
with
20
comments
How Much Did Jim Schwartz's Attempted Challenge Cost the Lions?

But because Schwartz threw the challenge flag on a play that would have been otherwise reviewed automatically, he received an unsportsmanlike penalty. The result was that the play was not reviewed by rule, and Forsett's TD stood. That gave DET a touchback up by 3, giving HOU a 0.35 WP.
That's a cost of 0.17 WP. It essentially doubled HOU's chances of winning at that point.
published on 11/22/2012
with
18
comments
Year-to-Year Improvement and Decline at QB

published on 11/21/2012
with
8
comments
Washington Post: Griffin Is One of the Biggest Upgrades of the Decade
 This week's article at the Post looks at the biggest upgrades and (declines) at QB of the past 11 years.
The biggest year-to-year decline belongs to the Vikings and Brett Favre. Favre’s 2009 season marked an increase in quarterback EPA of 152 points. But as Favre giveth, Favre taketh away. In 2010, the Vikings’ combination of Favre, Joe Webb and Tarvaris Jackson sunk Minnesota with a drop in EPA of 212 points. Favre’s late tears with Green Bay were also a roller coaster. His decline from 2005 and his resurgence in 2007 both rank among the biggest swings of the recent decade.
Also check out this companion post that features each team's year-by-year improvements and declines at QB.
published on 11/21/2012
with
4
comments
Weekly Game Probabilities
Game probabilities for week 12 are up at the New York Times' Fifth Down.
This week I share my thoughts about the 'tired arm' theory regarding Eli Manning's recent slump.
published on 11/21/2012
with
0
comments
Playoff Forecast - Week 12
As always, these numbers come courtesy of Chris Cox at NFL-forecast.com and are generated with the help of his NFL-Forecast software app, which uses the win probabilities generated by the team efficiency model to create a Monte Carlo season simulation. And if you don't buy the game probabilities from Advanced NFL Stats, you can tweak them as much as you like to generate your own playoff projections. I encourage everyone to download the app and test out your own scenarios.
Last week belonged to CIN, who added 17 percentage points to their overall playoff chances. This was thanks to a chain of events almost all of which favored the Bengals. PIT, MIA, and IND all lost while CIN won big themselves.
PIT and MIA tied for the biggest overall drop at 10 percentage points due to the same combination of events.
On the NFC side, GB jumped up 16% while D ET dropped 12%.
published on 11/21/2012
with
1 comments
Weekly Game Probabilities
Game probabilities for week 12 are up at the New York Times' Fifth Down.
This week I consider the theory that Eli Manning's mid-season swoon could be due to a "tired arm."
published on 11/21/2012
with
3
comments
Team Efficiency Rankings - Week 12
Let's play a game. It's called Guess Who Won. Team H was at home hosting Team V. Team H threw for 7.5 YPA with no interceptions. Team V threw for 5.0 YPA with 2 interceptions. The adjusted YPA was 7.5 for team H and 3.2 for team V. Each team lost one fumble and had the about the same sack yards. Team H was outrun by team V, by 167 yds to 97. But both team's run SR were within 2% of each other. Also, team H had 133 return yards (not counting kickoffs) compared to only 15 for team V.
Which team won?
Extra hint: Before the end of 60 minutes, Team H scored 3 TDs compared to Team V's 2 TDs.
Extra, extra hint: Team V received a kickoff down 8 points with a 0.05 WP with 6 minutes to play, needing a TD and a 2-pt conversion just to tie. And by the way, Team H has a (statistically) above average defense so far this season.
Guess who won! If you guessed Team V, you're correct. TB beat CAR in OT.
My point is not to find a sniveling weasel-like excuse for the efficiency model's ranking of CAR as a top 5 team despite it's 2-8 record. (Ok, you got me, that's partially why I'm pointing this out.) The other reason is far more interesting.
What team does CAR remind you of in terms of GWP vs actual record? It reminds me a lot of the San Diego Chargers from a couple years back. SD had gaudy stats across the board. The efficiency model had them ranked exceptionally high week after week, but they defied the probabilities and found ways to lose games despite having better athletes and very often better bread-and-butter performance on the field than their opponents.
I am not saying the model is the true measure of a team and therefore any significant deviations are statistical flukes. I'm suggesting the opposite. There are significant factors not captured by the model, and one of those factors is Panthers head coach and former Chargers defensive coordinator Ron Rivera.
Admittedly I don't follow the Panther's from play to play and game to game, so I won't jump to conclusions. but to those out there who do follow Carolina, please tell me why he should be kept on as the head coach.
Here are this week's rankings. As always click on the headers to sort. Team efficiency inputs can be found below.
published on 11/20/2012
with
40
comments
Panthers Punt Away The Win
 On Saturday, I watched as my Northwestern Wildcats punted on 4th-and-1 from midfield, up three with 1:30 remaining. A conversion would have guaranteed a win, allowing the Cats to kneel down. By punting to Michigan State, I was certain NU would lose in dramatic fashion once again. Luckily, the Cats defense came up big, making what seemed like their first fourth-quarter stand of the year. Ron Rivera had an eerily similar decision against the Bucs this week.
With just over a minute left, the Panthers had the ball at the Tampa Bay 49, up 21-13. The Bucs had used all three of their timeouts, so a conversion wins the game. Not only do the Panthers have one of the best goal line backs in the league in Cam Newton, but they also have the human bowling ball, Mike Tolbert, who was born and bred for those situations.
published on 11/19/2012
with
16
comments
Sunday's Numbers Have Been Crunched
published on 11/19/2012
with
1 comments
Holiday Gift Guide for Statheads

For those of you a little less dedicated to the cause, I thought I'd put together a list of my recommendations for gifts suitable for the stathead in your life, which just might include yourself. In no particular order, here are some gift ideas with an advanced statistical bent.
First off, treat yourself to some of these very stylish duds. Then, consider some of these great gift options:
published on 11/18/2012
with
8
comments
Playoff Forecast - Week 11
As always, these numbers come courtesy of Chris Cox at NFL-forecast.com and are generated with the help of his NFL-Forecast software app, which uses the win probabilities generated by the team efficiency model to create a Monte Carlo season simulation. And if you don't buy the game probabilities from Advanced NFL Stats, you can tweak them as much as you like to generate your own playoff projections. I encourage everyone to download the app and test out your own scenarios.
IND really improved their wildcard chances this week. It's the Colts and everybody else gunning for a wildcard berth. The other battle in the AFC is going to be for the 2nd seed between BAL, DEN, PIT, and NE.
In the NFC the wildcard chase is SEA and everybody else. If DAL gets in, it looks like they'll have to win the division. I still think NO is undervalued by my model.
These numbers do not count BUF's win over MIA last night. Sorry about that. For up to date numbers, you can always go straight to nfl-forecast.com.
published on 11/16/2012
with
2
comments
Weekly Game Probabilities
Game probabilities for week 11 are up at the New York Times' Fifth Down.
This week I take a look at alternate estimates for the BAL-PIT game due to Roethlisberger's injury.
published on 11/15/2012
with
12
comments
Josh Freeman Discovers The Deep Ball
Tampa Bay Buccaneers opponents are getting used to an unfortunate sight: the Josh Freeman deep ball. Freeman hit on two more 30-plus yard passes against the Chargers in Sunday's victory, this 54-yard dart to Mike Williams and this 31-yard strike to Vincent Jackson.
Freeman has now completed 32 deep passes (at least 15 yards downfield) for 1,064 yards, five touchdowns and just one inteception, accounting for nearly 70 expected points added. All this has come in just 68 attempts -- Freeman is averaging 15.6 yards per deep attempt and over an expected point per throw.
We shouldn't be surprised. Freeman made his way into the first round of the 2009 draft despite mediocre college numbers, mostly thanks to his size and the arm strength that comes with it. He was compared to players like Daunte Culpepper and Ben Roethlisberger -- huge quarterbacks who (at least at one point in their careers) made a living off the deep ball.
For some reason, Freeman and the Bucs never really embraced the deep ball before this season. Freeman went deep on just 14 percent of passes last season, dead last among 39 qualified quarterbacks. He threw deep less often then players like Tyler Palko, Ryan Fitzpatrick, Kyle Orton and Matt Hasselbeck -- inexplicable, given the respective skill sets. Chad Pennington threw 18.7 percent deep passes in 2008, his last full season.
This seems to be the major revelation of the Greg Schiano-Mike Sullivan establishment in Tampa Bay: Josh Freeman has the fabled "big arm," so why not use it? This season, Freeman has gone deep on over a quarter of his pass attempts; his 25.3 percent ranks third in the league behind Joe Flacco and Andrew Luck. The concept isn't particularly difficult -- let Freeman drop back, and if the pocket holds, he has the arm to get it to the receiver down field.
published on 11/15/2012
with
0
comments
Washington Post: What Analytics Can and Can't Do in Football
This week's article at the Post takes advantage of the Redskins bye week to take a step back and discuss what analytics can and can't do in football.
...We can look at which teams succeed more often in various situations and rank them. Unfortunately, that’s almost all we can do with this type of approach. It’s great fodder for Internet message board arguments, but it doesn’t help teams gain an edge.
To really help coaches, a deep understanding of how teams come to win games is required. Advanced models such as Win Probability and Expected Points are very powerful tools, because of what an economist would call “linear utility functions.” The term linear refers to the quality of proportional desirability. For example, it’s exactly twice as good to have a 40% chance of winning a game as a 20% chance of winning a game. You can’t say that about total yards or simple points...
published on 11/14/2012
with
4
comments
Team Efficiency Rankings - Week 11
The equation here is pretty simple. Take a solid defense. Add Peyton Manning. You get a team that's very hard to beat.
published on 11/13/2012
with
18
comments
Sunday's Numbers Have Been Crunched
published on 11/12/2012
with
6
comments
Play-By-Play Data Updated
Play-by-play data through week 9 of the 2012 season has now been updated.
published on 11/10/2012
with
1 comments
To Fake or Not To Fake: Fourth Down Decisions
 After we wrote about Mike Tomlin's fake field goal decision in Week 9, it got me thinking about the general success rate of fakes versus typical fourth down attempts. Before moving forward, it should be noted that it is difficult to pull fake field goal and fake punts out of play-by-play data because they are not explicitly specified as such. So, you may be getting an aborted or bad snap or the field goal/punt formation may not have been recorded. We attempted to clean the data up as much as possible, which resulted in 213 fourth down fakes since 2000.
Similarly, we looked at the roughly 5500 fourth down normal go-for-it attempts. Granted, a lot of these will take place at the end of the game when teams are down by significant margins or must go for it in order to stay in the game, but that should not greatly affect their conversion rates. It may give us a sample bias, though, because those teams that are losing are typically worse offensively.
Fake attempts are exceedingly rare and given that there are only 200 or so attempts, we must be cautious of sample size issues. The most frequent fake attempts are on 4th-and-1 or 4th-and-2 which have happened about 30 times a piece. Compare that to over 2000 regular go-for-it attempts on 4th-and-1 and over 600 regular attempts on 4th-and-2.
published on 11/10/2012
with
11
comments
Playoff Projections - Week 10
As always, these numbers come courtesy of Chris Cox at NFL-forecast.com and are generated with the help of his NFL-Forecast software app, which uses the win probabilities generated by the team efficiency model to create a Monte Carlo season simulation. And if you don't buy the game probabilities from Advanced NFL Stats, you can tweak them as much as you like to generate your own playoff projections. I encourage everyone to download the app and test out your own scenarios.
The AFC wildcard competitors appear to be either BAL or PIT, depending on who loses the division, plus IND, MIA, SD, and NYJ. In the NFC, it's looking like either CHI or GB, whichever team comes in second, plus SEA, DAL, MIN, and a bunch at 10% or below. Despite what the numbers say, it looks like NO has improved significantly beyond their early-season lows and have a better shot than indicated.
These numbers do not count IND's win last night. Sorry about that. They were heavily favored by the model, so the effect is modest. For up to date numbers, you can always go straight to nfl-forecast.com.
published on 11/09/2012
with
11
comments
Weekly Game Probabilities
Game probabilities for week 10 are up at the New York Times' Fifth Down.
This week the lead-in summarized my recent post on the dangers of misplaced confidence in analytic models of open, real-world systems.
published on 11/08/2012
with
4
comments
Andrew Luck: Thriving In The Manning Shadow
Andrew Luck capped his first half-season in the NFL with an indisputably great performance Sunday, as his 433 passing yards on 48 attempts (9.0 yards per attempt) and two touchdowns pushed the Colts past the Dolphins, 23-20. The victory pushed what was a hapless Indianapolis team last season to 5-3 and into the playoff hunt. It's unclear if the Colts can keep riding so high -- they rank just 26th in our efficiency ratings and NumberFire has them in the playoffs in 51.5 percent of simulations.
Luck's sharp performance goes beyond just Week 9's effort. He'll enter Week 10 ranked fourth in WPA, eighth in EPA and ninth in EPA per play. His only advanced stat blemish might be his 5.4 AYPA, tied for 16th with Ryan Tannehill and Joe Flacco, stemming from his 30th-place 56.5 percent completion rate. But given the weight placed on Luck's shoulders in this Indianapolis offense -- his 336 attempts rank third in the league.
Given the 14 brilliant years of service Peyton Manning gave the Colts prior to his neck injury and subsequent release, the former Colts All-Pro will constantly be used as a measuring stick for Luck. Just looking at the rookie years, one would imagine Luck will become the greatest quarterback ever. Manning threw a whopping 28 interceptions (4.9 percent of passes) in year one and managed a rough 4.0 AYPA. Many players have posted superior rookie seasons leading into less-than-Hall-of-Fame careers. See, for example, Neil O'Donnell, Jim McMahon, Joe Flacco and Jake Plummer.
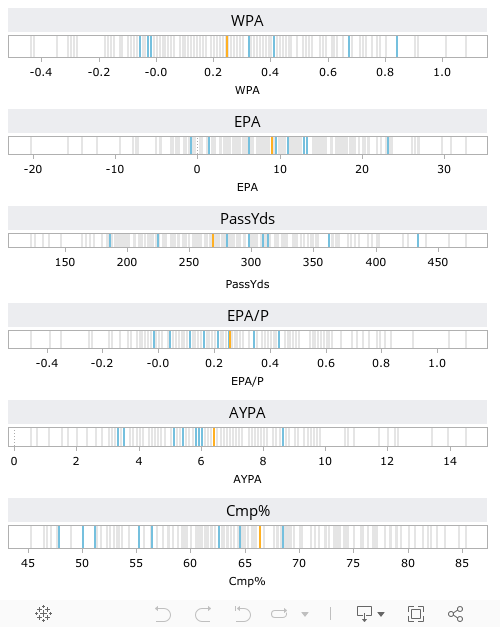
As such, it may be more educational to compare Luck to Manning's Colts career as a whole -- or at least the 12 seasons worth of data we have here at Advanced NFL Stats (dating back to 2000). Luck's games are in light blue, Manning's games are in gray and Manning's averages are in Bronco Orange.
published on 11/08/2012
with
3
comments
Game Notes: Eagles fall to the Saints

• On the Eagles' first drive, Michael Vick looked quite good when he had time to throw the ball. The drive ended when he fumbled the ball and set the Eagles back twenty yards.
published on 11/07/2012
with
1 comments
Team Efficiency Rankings - Week 10
Week 10 already. The season seems like it's flying by. The biggest mover this week is PHI. They started the season high on the rankings. Their defense looked very strong, and their offense was moving the ball. The only thing holding them back was turnovers, which tend to regress very strongly. Well, they haven't in PHI's case, meanwhile their pass protection has collapsed and their defense has regressed to league average.
CAR is still the mystery team, so let's take a quick look at why a 2-win team is ranked 4th. They have the 4th most efficient passing offense, league-average run success rate, and a better than average offensive turnover rate. They have an above average defense, ranked 11th in both the run and pass--which makes them much better than 11th, by the way. Plus, CAR has a slightly better than average penalty rate. Add in that they've faced the 4th toughest schedule so far, and they look like a team that should win nearly 2 out of every three games.
Here are the efficient rankings for week 10. Click on the headers to sort. The efficiency components of the model are in the second table below.
published on 11/06/2012
with
12
comments
Four 4th Down Decisions: Steelers Go Strictly on Feel
 Big Ben and Eli Manning faced off against each other Sunday, leading the teams that have won four of the last seven Super Bowls; Manning and Roethlisberger will always be linked as the No. 1 and No. 3 QBs taken in the 2004 NFL draft. Let's look at the plethora of interesting decisions between the coaches.
What first tickled my fancy was when the CBS announcer mentioned that, "Mike Tomlin says he makes all these decisions strictly on feel." This was before the Steelers went for it on 4th-and-1 from the Giants 48-yard line, down 7 in the second quarter. After I shuddered at the quote, I checked out the 4th-down calculator to confirm my notion that this was one of the easier football decisions to be made:
published on 11/05/2012
with
7
comments
Sunday's Numbers Have Been Crunched
published on 11/05/2012
with
6
comments
Analytics and the Ludic Fallacy

One of the most visible applications of analytics in this year’s election is the FiveThirtyEight blog, created by Nate Silver. For those who may not be familiar with Nate, he is a noted baseball sabermetrician best known for creating the PECOTA prediction model. His election forecast has favored Obama more heavily than most others throughout the election season, and he has been the target of criticism recently.
In defending his approach, Nate and others have explained his probabilistic reasoning with examples from football. The 90% or so chance Nate gives Obama to win the Electoral College is, for some reason, put in football terms…Romney is down by 3 with 2 minutes to play…or Romney is down 7 with 5 minutes to play…or something along those lines. (I think that's ironic given that even football experts don't seem have a good grasp of situational probabilities.)
I disagree with those analogies, but not because I have any better reason to think that either candidate will win. I think the situation is more like this: Romney is down by a very small number of points with 1 minute to play, and we don’t know who has the ball or where the line of scrimmage is. Or maybe it’s more like this: Romney is down by a point or two and has just snapped a long field goal attempt, and no one has a very good idea which way the wind is blowing. If it was blowing just like it was last game, the kick will almost certainly come up short. But if the wind is blowing more like it did two games ago, he’ll probably make the kick and win.
published on 11/04/2012
with
54
comments
Playoff Projections - Week 9

The Texans have the inside track in the AFC and the Falcons have it in the NFC. No surprise there. The AFC South, AFC West, NFC South and NFC West appear to be locks for the Texans, Broncos, Falcons, and 49ers. The one counter-intuitive projection is that Baltimore is not the favorite in the AFC North despite having a full game lead on Pittsburgh.
published on 11/02/2012
with
7
comments
The Extra Point Must Go
This week's article at the Post asks What's the point of the extra point?
The extra point is something left over from gridiron football’s evolution from rugby. Originally, the ‘touchdown’ in rugby was less important than the ensuing free kick, and the points given for the touchdown and the ‘point after try’ varied during football’s early history. Today’s extra point is a vestige of football’s rugby roots. It’s football’s appendix–inconsequential, its original purpose uncertain...and safe to remove.
published on 11/01/2012
with
19
comments
Weekly Game Probabilities
Game probabilities for week 9 are up at the New York Times' Fifth Down.
This week I look at what's wrong with the Steelers defense.
published on 11/01/2012
with
1 comments
Which Teams Should Run More?
If I read one more of these articles in the Baltimore Sun, I think I'm going to throw up.
...Ray Rice consistently ranks as one of the most productive and dynamic running backs in the NFL, capable of eluding defenders on the ground and through the air. He benefits from running behind bruising All-Pro fullback Vonta Leach, who's regarded as the most devastating lead blocker in the game. Yet, the Ravens have fallen to 19th overall in the NFL in rushing yards per game with an average of 104 yards per contest. And Rice ranks 12th on the rushing chart individually with 524 rushing yards...
The article goes on to add:
Blah blah blah. Run more blah. Need to find their identity blah blah.
Ok, I made that second part up. Actually, I have to give the author credit for attempting at least a surface level statistical analysis. But the fetish that sports columnists have with the running game has been one of the most enduring false narratives in the sport of football. It's time to put it to rest. I get that offenses have to run to keep defenses honest and to set up the passing game, but they don't have to run as often as they generally do to accomplish those things.
 Let's take a look at offensive Expected Points Added per Play by play type. EPA/P accounts for all play outcomes--sacks, interceptions, fumbles, gains, losses, first down conversions, and so on--in other words, everything. Naturally, an offense would want to do more of the kinds of plays that gain them more and do less of the kinds of plays that gain less. Although this should be intuitively understood, zero-sum game theory proves that the optimum total production is when payoffs are equalized across strategy options.
Teams with high differences between pass payoffs and run payoffs should probably be running more often. And although you might think that teams with higher run payoffs than pass payoffs should be running more, that may not be true due to the passing paradox: Underdog teams that are poor at passing may need to do it more often to generate high variance outcomes.
The table below lists each offense's passing and running EPA per play, their total EPA per play, the difference between pass and run EPA/P, and their proportion of pass plays. I limited the analysis to 'normal football' where the score is relatively close and time is not yet a factor in play selection. The teams are ranked by the difference between pass and run payoffs. Teams at the top of the list should be passing more, and the teams at the (very) bottom should be running more. (Click on the table headers to sort.)
published on 11/01/2012
with
25
comments
Subscribe to:
Posts (Atom)