
 Your opponent kicked a FG on the first possession of overtime, and now your team needs a TD to win or a FG to continue the game. Your offense has driven down to the opponent's 10-yard line, but the drive has stalled. It's 4th down and 3. Should you go for the risky conversion and ultimately a TD for the win, or should you attempt a FG knowing you'd be at a disadvantage giving the ball to the opponent in sudden death?
The new NFL OT rules are unique in a lot of ways, and by unique I mean convoluted and contrived. There are basically three possible game states:
1. The first drive in which no score leads to Sudden Death, a TD wins, or a FG spawns the second state...
2. A possible second possession in which the offense is down by 3 points. It must score a TD to win or a FG to continue into SD.
3. Lastly, traditional SD itself.
The three game states successively easier to model. The first possession must consider all the possibilities of the following two states. The second state must only consider itself and the possibility of SD. The second possession is also slightly easier to model because there is no punt option. An offense trailing by 3 points simply must score or lose.
New Overtime 4th Down Decisions When Down 3 Points
Sunday's Numbers Have Been Crunched

Cam Newton: The Best First Two Seasons Ever
This Sunday, Cam Newton will finish his second NFL season. As the final whistle blows in the Panthers' final 2012 contest against New Orleans, Newton will have finished the greatest first two seasons we've ever seen out of an NFL quarterback. And at least in the realm of the regular season, it isn't particularly close.
Newton enters Sunday with the following career statistics: 574-for-969 passing (59.2 percent), 7,672 yards, 40 touchdowns, 28 interceptions; 246 rushes for 1413 yards (5.7 per carry) and 22 more touchdowns. Newton's 8,584 net yards -- including 70 sacks taken for 501 lost yards -- the Panthers star has an exactly 800 yard lead on Peyton Manning's old 7,784 net yardage mark, the previous best for any quarterback in his first two seasons. Newton still has one game left.
Newton's 7.9 yards per attempt ranks fourth (Ben Roethlisberger, Dan Marino, Mark Rypien). His 62 total touchdowns ranks second (Marino). Newton's only major category away from the top: a 2.8 percent intereception rate, still 16th of the 78 quarterbacks since 1933 to start at least 20 games in their first two seasons. Only Andy Dalton attempted more passes than Newton of those above him on the list.
My Gift to Football Columnists: The Sports Column Generator

Life is especially tough for columnists because so much of what happens on a football field can't be pinned down to any particular cause. A plausible narrative has to be invented and defended. After all, an essay like this doesn't fill up many column-inches:
Localtown, ST -- Sometimes our hometown team has two turnovers, sometimes it has one, and sometimes it has none. Sunday, it had two, one fumble and one tipped pass for an interception, and that's probably why they lost. The end.
Season after season of regurgitating the same narratives must get old, and I'm sure sometimes columnists feel like they could be replaced by a robot. Well, now they have.
Team Efficiency Stats - Week 17

Here are the team efficiency rankings heading into week 17. See the second table below for the raw inputs. Click the table headers to sort.
Sunday's Numbers Have Been Crunched
Calvin Johnson's Receiving Record and "Stats"

But the truth is that the record for most receiving yards (or rushing yards or whatever yards) is not "a statistic." It's trivia. It's the answer to a question on the ESPN sports-trivia-a-day calendar you just bought for your nephew for Christmas. It's the kind of thing that gives stats a bad name, or at least a misleading one.
Don't get me wrong. I think Calvin Johnson is awesome, and all the numbers agree. Fans and media are right to make a big deal out of such an accomplishment. It's just that records like this are what most people think of when they hear the word statistics. It's understandable then, that when coaches or players think of stats, they dismiss them as pointless or "for losers." After all, how could knowing who holds the record for most receiving yards in a season, or memorizing how many yards that is, possibly help a team win?
How Much Is Joe Flacco Worth?

Statistically, he's just as hard to figure out. Among all QBs since 2008, when Flacco entered the league and began his uninterrupted starting streak, his WPA has exceeded his EPA. Of the 30 QBs with the most attempts since 2008, Flacco has the 3rd highest ratio of WPA to EPA. Most observers would call him "clutch."
Based on the recent historical relationship between QB performance and salary, we can estimate Flacco's market value. But depending on how we value his production, we get very different salary values.
Flacco is remarkably consistent. Receivers come and go, and lineman come and go, but since his rookie year Flacco is a rock solid 70 EPA per year guy. Adjusting for team cap inflation, that makes Flacco worth approximately:
The Jets' Post-Mark Sanchez Landscape
Congratulations are in order for Mark Sanchez. The erstwhile Jets starter joins an exclusive club this season, as he becomes one of four quarterbacks since 2000 to post four consecutive seasons with a 0.05 EPA/P or worse:
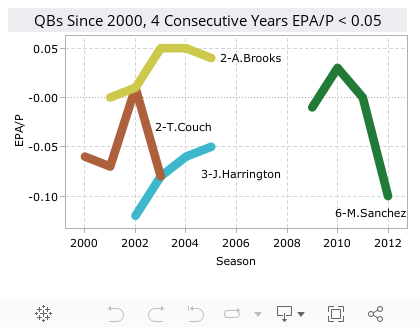
Mark Sanchez. Aaron Brooks. Tim Couch. Joey Harrington. It's a remarkable list* not because of how bad these players were but because of how long their teams decided to stick with them. But this is sometimes the trap teams fall into with quarterbacks -- they become pot committed, too invested in the quarterback's success to back out and push the reset button.
*We could probably add Jake Plummer to it if we had EPA data for the 1999 season, as he carried a streak from 2000-2002.
The immediate aftermath for the three other squads has not been pretty. They combined to win just 17 games over the next three seasons combined, for an average record of 5.7-10.3. Only the Saints managed to pull themselves out of the mess thanks adding Drew Brees and Sean Payton before the 2006 season -- and they still missed the playoffs in two out of the three seasons.
What sets Brooks apart from Couch and Harrrington (and Sanchez) is Brooks wasn't a first round pick. He was a fourth-round third-stringer acquired from the Packers and he only earned a start with the Saints thanks to injuries. Brooks ran with the opportunity and turned it into five seasons as the Saints' starting quarterback.
The Browns and Lions, on the other hand, given the investment (both in terms of money and the early draft pick) in their failed quarterbacks, had much farther to climb to get back to respectability. Both have made just one playoff appearance since, and the clubs have combined to average under five wins per season each.
Could the Jets be in for a similar down period in Sanchez's wake? To get more than just two other quarterbacks to compare him to, let's look at first-round drafted quarterbacks to stay with the same team and post a 0.05 EPA/P or worse for three consecutive years (instead of Sanchez's four):
Playoff Projections - Week 16
As always, these numbers come courtesy of Chris Cox at NFL-forecast.com and are generated with the help of his NFL-Forecast software app, which uses the win probabilities generated by the team efficiency model to create a Monte Carlo season simulation. And if you don't buy the game probabilities from Advanced NFL Stats, you can tweak them as much as you like to generate your own playoff projections. I encourage everyone to download the app and test out your own scenarios.
It's always fun to go back earlier in the season to see how far off the initial projections were. In Week 9, the projected division winners in the AFC were NE, PIT, HOU, and DEN. (BAL and PIT were about 50/50, as were NE and MIA(!).) The most likely wildcards were BAL and MIA. OAK looked to be a better shot than either IND or CIN. Ouch.
In the NFC the forecast winners were NYG, CHI, ATL, and SF, although CHI was only at 50%. The NFC wildcards were GB and SEA. Not too shabby.
Why Is a Backup RB a Fantasy Star?

Jason recently theorized why David Wilson, a backup RB for the Giants, is on rosters of winning fantasy teams. (His teams have the 6th best winning percentage of all NFL players.) His theories were:
1) Smart fantasy players overlook previous outcomes and understood his ability to have a high payoff as a RB on a team that can move the ball.
2) Wilson was a scrub who was stuck as a backup behind teams who already had a very healthy RB situation with little reason to go digging for better options.
3) Wilson got his opportunity very late in the season after losing fantasy owners had long since given up prowling the waiver wire. Fantasy teams in the playoffs, which already solidified winning records, would tend to be the ones looking to plug holes in week 15.
All excellent theories, but I'd like to add 1,387 more to that list. Those are the number of return yards Wilson has accumulated this season. How does your league score return yardage? I bet you don't even know. The last time I won my fantasy league it was party because of Percy Harvin's massive return yardage. Return yardage is probably only part of the answer, but in many leagues it can be overlooked.
Weekly Game Probabilities - Week 16
 Game probabilities for week 16 are up at the New York Times' Fifth Down.
This week I highlight one the least interesting match-ups on a schedule packed with interesting games.
Team Efficiency Rankings - Week 16
SF and DEN lived up to their rankings last week. In fact, 8 of the top 10 teams won last week, and the only two losses were by teams beaten by higher ranked teams.
Cowboys Kick (Twice), But Still Win
 In one of the more intriguing match-ups of the weekend, Tony Romo and the Cowboys received the ball in a tie game just over midfield with 0:47 seconds remaining. After two incompletions and one pass to Jason Witten, the Cowboys faced a 4th-and-4 at the Steelers 43-yard line. With 0:32 seconds to go and one timeout left, the Cowboys trot out their field goal team for a miraculous 60-yard game-winning kick. Both teams would call timeout and Jason Garrett would ultimately decide to punt instead, essentially assuring overtime. Let's think about this decision generally before looking at the frequency specifics.
If you punt, you are conceding to play overtime, giving your team a 50/50 shot to win the game. If you kick a field goal from that range, the probability that it goes in is at best the same as the probability that you miss and your opponent can score before the end of regulation, giving you a 50/50 chance to win optimistically. If you go for it and convert, you will have a much higher probability of making the field goal even with time constraints -- if you fail, you are pretty much in the same situation as a missed field goal.
New Feature: Time Calculator

I created a new tool to estimate the time at which a trailing defense (or soon-to-be-trailing defense) can get the ball back if they force a stop. The results are based on the time at the first down snap of a series and the number of timeouts remaining for the defense. You can adjust the expected duration of each play and the time consumed between the previous whistle and the next snap when the game clock is not stopped. The defaults are 6 and 39 seconds respectively. The calculator assumes there will be no stoppages due to reasons other than timeouts and the two-minute warning, such as incomplete passes, runs out of bounds, or penalties.
One additional feature is that you can check a box called "Save Timeout." This will indicate that the team on defense would prefer to allow the clock to wind down to the two minute warning rather than stop the clock with a timeout. For example, if the defense has one timeout left and the second down play ended at 2:10, the defense can elect to save the timeout for its offense in exchange for running down the 10 seconds to 2:00. This is, in effect, a trade-off between the 10 seconds of game clock and having a timeout available for an offensive drive.
It's very difficult to quantify the value of the timeout on offense. It's intuitively very valuable because an offense can use the middle of the field, which otherwise allows the defense to guard the sidelines.
Try this: Enter 2:24 remaining with 3 timeouts. Leave the 6 sec and 39 sec defaults for play and inter-play durations. Click calculate with the Save Timeout option unchecked and checked (with the 12-second default cutoff value). With 'Save Timeout' checked, you get the ball back with 1:54 and retain a timeout for your offense. Without the option checked, you get the ball back with 2:00 on the clock and no timeouts, with the 2-minute warning essentially going to waste.
This option usually only makes a difference when the defense begins the series with all three timeouts remaining. It also may be smart depending on when a team can expect the change of possession to occur. The defense does not want change of possession to occur on a play that spans the two minute warning because that combines two potential clock stoppages into a single stoppage.
The workings of the NFL game clock is far more complex than it might seem. That's why I forced myself to build the calculator and think through all the considerations. The algorithm behind the calculator is basically a by-product of the one I used to create the chart below, which underpinned my analysis of when a defense should prefer to intentionally allow a TD.
C.J. Spiller and the Effect of Increased Carries
The NFL leader in expected points added for a running back? It's not rushing leader Adrian Petrson. It's not Marshawn Lynch, Doug Martin, Alfred Morris or Jamaal Charles -- the rest of the top five in rushing yards.
With 40.2 EPA -- a full 17 points clear of second-place Peterson -- Spiller holds the lead through Week 14. Despite only 144 carries -- 25th in the league, between Vick Ballard and Jonathan Dwyer -- he ranks 12th in rushing yards. His 944 on the season puts him between BenJarvus Green-Ellis and Shonn Greene, rushers with 94 and 86 more carries respectively.
Now, with Fred Jackson on injured reserve with a right knee injury, Spiller will be alone at the forefront of the Bills offense. Of course, Bills coach Chan Gailey qualified his statement:
"We'll play CJ as much as he can play," Gailey said. "Tashard [Choice] will rest him when he needs rest."
Last time Spiller was healthy and Jackson was out -- Week 10 against Miami -- Spiller received 22 carries, a career high, rushing for 91 yards and adding three receptions for 39 yards. At -0.2 EPA (-0.01 per play), it was his third-worst game of the season, but still better than the league running back average of -0.02 EPA per play.
Still, when a player puts up numbers like Spiller's over the past two seasons -- 6.0 yards per carry on 251 rushes -- one would figure his coaches have a reason for limiting his carries so heavily -- and a better one than just Fred Jackson's roster presence, capable as he may be.
But so far in his career, the only two times Spiller has gone over 16 carries -- the aforementioned Week 10 against Miami and 2011 Week 11 against the Jets (19 carries, 55 yards) -- he has had trouble. It's easy to get caught up in efficiency, but in many cases volume is valuable in and of itself.
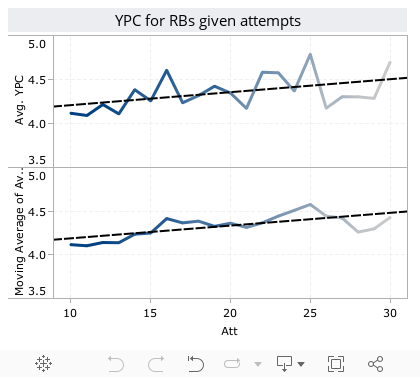
So, the question: is there reason to believe running backs get worse with more carries? In sports, we often see a usage-efficiency tradeoff -- pitchers get worse the deeper they go in games, basketball players tend to shoot a worse percentage the more looks they take from the field, and, as detailed last week, quarterbacks get less efficient the more than have to throw the ball. Does the same apply to runners?
To answer the question, I pooled all games of at least five carries and fewer than two passes (to weed out running quarterbacks) from 2010 through this season, a total of 2349 games featuring rushers from Aaron Brown to Willis McGahee.
There actually appears to be a positive correlation -- more carries means more yards per carry -- but this is lkely due to survivor bias. That is the players who don't earn at least 10 carries don't get them, dragging the average down at the low end, and the players who get 30+ carries are typically destroying opposing defenses. Chopping off the extremes and looking at games with 10-30 carries gives us a nearly flat relationship:
Playoff Projections - Week 15 *Updated*
As always, these numbers come courtesy of Chris Cox at NFL-forecast.com and are generated with the help of his NFL-Forecast software app, which uses the win probabilities generated by the team efficiency model to create a Monte Carlo season simulation. And if you don't buy the game probabilities from Advanced NFL Stats, you can tweak them as much as you like to generate your own playoff projections. I encourage everyone to download the app and test out your own scenarios.
Weekly Game Probabilities
Game probabilities for week 15 are up at the New York Times' Fifth Down.
This week I examine how some outlier teams can break the model, including this season's NE Patriots.
...Malcolm Gladwell’s book “Outliers” popularized the term in his title, but the exceptional people he featured in his best-seller were not actual outliers. If I spend five hours trying to learn to play the violin, I’ll stink. But if someone else spends 10,000 hours practicing violin, we would of course expect that person to be great. That’s entirely predictable and fits our model of practice makes perfect. A true outlier would be someone who spent only a few hours practicing, yet was still a violin prodigy.
Sometimes teams come along and break my model, and the 2012 Patriots are one of those teams...
When to Intentionally Allow a Touchdown, Part 5

Putting It All Together
Taking a step back, the goal is to compare two strategies for the defense. The first is to play conventionally and force a stop and a FG attempt, hoping it will either fail or that there is enough time to match it with a counter-score. The second is to intentionally allow a TD immediately and use the time remaining to respond with a counter-TD.
So far, we have estimates for the key inputs:
-When the team on defense would get the ball back
-The probability of failure on the FG attempt
-The probability of responding to a made FG with a score
-The probability of responding to an allowed TD with a TD
When to Intentionally Allow a Touchdown, Part 4

The Probability of Responding to a Successful FG
If the defense plays conventionally, and the opponent's FG is successful, a score will be needed to win. Either a FG or TD will do. We can assume that the drive will began at or very near the offense's own 20-yard line for a couple reasons. First, the average starting field position for all drives is the 22. And second, it's very likely that, with time at a premium, the offense would prefer a touchback so that no time expires on the kickoff.
For this estimate, I looked at all game situations in which an offense needed a score to survive and had a 1st down at or very near its own 20. Success is defined as any drive that results in a TD or FG.
The blue line is the raw success rate as a function of seconds remaining at the 1st down snap. The red line is the smoothed estimate of the probability of scoring based on a local regression. Because there were several bins of data with very few cases (which caused the large noisy swings in the raw averages), I used a regression method that weighted each case by how often it appeared. In other words, if there were 10 cases where a team gained possession with around 50 seconds to play and 20 with around 60 seconds to play, the regression weighted each bin of cases proportionately.
Team Efficiency Rankings - Week 15

Here are the rankings headed into week 15. Click on the headers to sort. Raw efficiency stats are in the second table below.
When to Intentionally Allow a Touchdown, Part 3

Field Goal Success Probability
The simplest way to win for a defense caught in the field goal choke hold is to pray for an unsuccessful FG attempt. This is a mostly straightforward calculation but has a couple wrinkles. The success rates here include all possible causes of a FG ultimately being unsuccessful. That includes blocks, botched snaps, and even penalties that force longer attempts which turn out unsuccessful.
Also, as mentioned previously, an estimate of the expected field position on 4th down is required. For now, I will say that the offense will gain 5 yards during its 1st, 2nd and 3rd down plays. This is essentially a plausible placeholder for now, and a more detailed analysis can be done to confirm or adjust this.
The graph below shows three things. The jagged blue line is the actual raw FG success rate by line of scrimmage. (Add 17 or 18 yards for the commonly used 'kick distance'.) The red line is the estimated true probability of success. This estimate was computed non-parametrically, using locally weighted regression. The green line is the same curve as the red line, but offset 5 yards closer to the uprights. (Inside the 10, the 5 yards are progressively curtailed.)
When to Intentionally Allow a Touchdown, Part 2

Time Remaining Following a Forced FG
The first task of the analysis was to create an algorithm to compute the time on the clock when the team on defense would get the ball back following a forced FG. This is a function of current time and time outs remaining for the defense. For example, suppose the offense has just converted a series so that the 1st down snap will happen at 1:20, and the defense has two timeouts. The offense will run three times, you'll call both timeouts, and following a FG, you'll probably get the ball back with 17 seconds remaining. The two-minute warning is factored in, which is more challenging than it might seem.
The time-you-get-the-ball-back algorithm assumes that the defense will use its timeouts at every immediate opportunity. The only exception will be when the play itself spans the 2-minute warning. For example, if there is 2:10 on the clock at the snap and the play duration is 6 seconds, the defense will call a timeout at 2:04 rather than allow the clock to wind down to the 2-minute warning.
However, there is a special case where the defense may want to allow the clock to run down to the two-minute warning rather than use all its timeouts. For example, if there is 2:10 remaining between 2nd and 3rd down and a team has 2 timeouts remaining, it may chose to allow the clock to wind down to 2:00. The third down snap would occur following the two minute warning, and the defense would call its 2nd timeout between 3rd and 4th down, at around 1:54. This would allow the defense to save one timeout for use on offense.
Sunday's Numbers Have Been Crunched
When to Intentionally Allow a Touchdown

The Field Goal Choke Hold situation looks like this: The defense has a lead of 1 or 2 points with less than 3 minutes to play. The opposing offense has just converted a first down inside FG (attempt) range. Through week 13 this season there have been 12 games that qualify, which makes this situation about as common as overtime. (There were 12 more games with similar circumstances except the game was tied, a situation nearly identical but that requires some slightly different math.)
Two strategies are compared. The first is playing for the stop and forcing the FG attempt. This may be dangerous due to the ability of the offense to burn clock. The second strategy is to allow an immediate TD. This strategy forfeits points to the opponent in exchange for enough time to respond with a game-winning TD drive.
There is no guarantee the offense will take the bait and score a TD. If the offense is cognizant of the strategy, they may take a knee close to the goal line. So strictly speaking, this analysis merely estimates which combinations of circumstances make an immediate TD preferable to forcing a FG attempt. Even if all offenses were prepared for this contingency and were inclined to take a knee, this analysis lays out when that would be the smart move.
Sportsman of Year?

As a consolation, Sports Illustrated was kind enough to do an in-depth article on analytics in the NFL, prominently featuring Advanced NFL Stats. Many thanks to writer Albert Chen who captured the concepts and background far better than many reporters. If you've ever wondered what the Taliban and Al Qaeda have to do with the creation of the win probability model, this article will answer your questions.
You'll have to buy it off the local news stand. It's in dead tree format only, at least for now (unless you're a subscriber). It's the double issue with LeBron on the cover, page 124. Grab a copy before my mom buys them all.
Deadspin/Slate: The Effect of Eliminating Kickoffs
Here's the Slate link. Here's the Deadspin link.
...With proposed rule changes like these, I ask myself, "What if things had always been this way? Would we want to change from that to the way things are now?" If football didn't have the extra point—an odd play that's meaningless to game outcomes 99.9 percent of the time—would we want to invent one? Probably not.
In this case, if we'd always started the game with a punt, would we want to invent the kickoff? It's not so clear. With the yard line of the kickoff now at the 35 and as placekickers continue their trend of booting the ball farther, it won't be long before every kickoff is a touchback. The kickoff might soon become like the extra point—a boring formality...
I strongly recommend Keith's post on the subject too.
Washington Post: Griffin Is Transcending His O-Line
 This week's article at the Post looks at which of the league's QBs are outperforming their offensive lines the most. Surprise! RGIII tops the list.
Despite his line’s performance, Griffin has been able to produce consistently, ranking third overall with 120 EPA this season. That’s 10 net points per game. Only Tom Brady and Matt Ryan currently have more total production. The distinction of ‘net’ points versus absolute points is important. It means that however many points a typical opponent is able to generate in a game, Griffin is responsible for 10 more points than that.
The difference between Griffin’s personal rank (3) and the Redskins offensive line’s rank (28) is 25 spots. No other quarterback has a bigger rank difference between his own and his line’s performance. Matt Ryan is a distant second at 21 spots of rank difference.
Weekly Game Probabilities
Game probabilities for week 14 are up at the New York Times' Fifth Down.
This week I revisit Sanchez's performance and his contract extension from the off-season.
Schiano's New Kickoff Concept
Recently, Profootballtalk published an article discussing potential plans to eliminate an opening kickoff entirely (H/T to Abe Schwadron of TDDaily.com).
"Sean Gregory of TIME writes that one of the options being considered for replacing kickoffs entails giving the ball to the team that would have been kicking off at its own 30, automatically facing a fourth down and 15 yards to go. The team can then choose to punt or go for it, via fake punt or otherwise.
In other words, the kickoff would be replaced with the punt, and the onside kick would be replaced with a fourth-down conversion roughly half the distance of Ray Rice’s recent catch-and-run."
One Point Favoring Andrew Luck over Robert Griffin III
Arguments on the Rookie of the Year seem to be favoring Robert Griffin III over Andrew Luck at this point in the season. Griffin's performance has been spectacular, certainly -- he's thrown for 2,660 yards and 17 touchdowns against just four interceptions. His 714 rushing yards on 105 carries translates to a league-leading 6.8 yards per carry, and his 6.5 AYPA is tied with Peyton Manning for third in the league.
Luck runs well, but nowhere near Griffin's standard -- he owns 216 yards on 44 rushes. Luck has thrown for over 900 more yards than Griffin and matched Grffin's 17 touchdowns. But his AYPA is a middling 5.1, 21st in the league and tied with Andy Dalton. Griffin has a 23-point EPA advantage and a 0.09 point per play advantage.
But for those who prefer to use more context-neutral stats -- as opposed to WPA, which has Luck second in the league at 4.32, over 1.5 wins better than Griffin -- there is one point in Luck's favor: the sheer volume of his output.
Washinton's' offense is obviously focused on Griffin, but the team uses the run liberally, rushing over 22 times per game (not counting Griffin's rushes). Alfred Morris carries the bulk of the load, with 1,106 yards (4.8 per carry) on the season. The Colts have rushed just 22 times per game themselves, but they've also run 117 more plays (just under 10 per game) more than Washington, and those extra plays are all directed through Luck and the passing game. All told, Luck has thrown 14 more passes per game than Griffin.
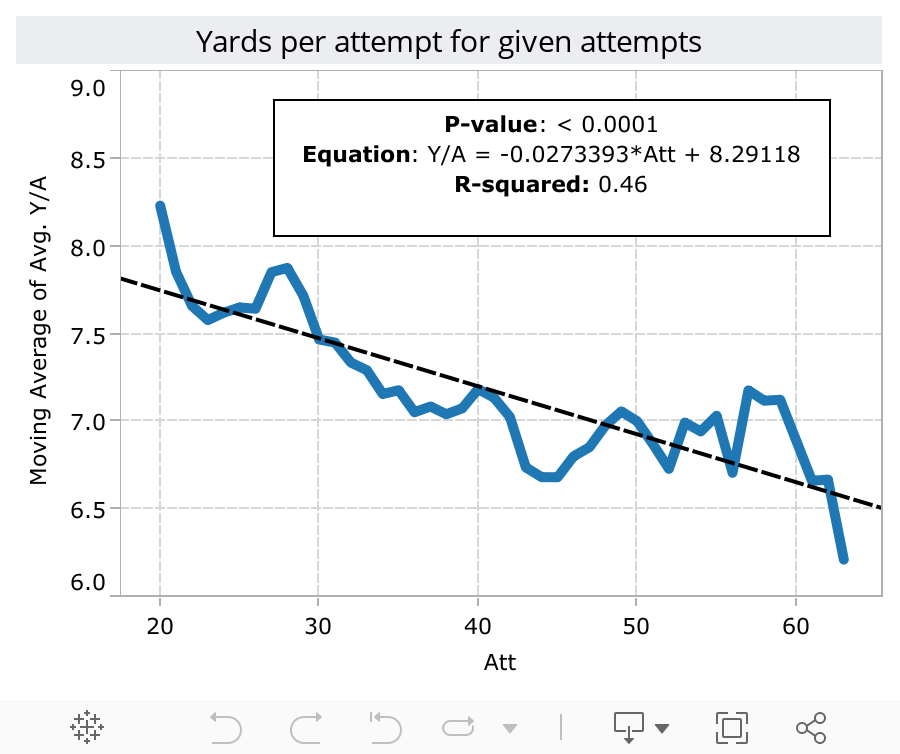
Basketball analysts have picked up on an essential point of the game: as usage rate -- the burden of the offense -- increases, efficiency tends to decrease. Steve Kerr was a more efficient scorer for the 1995 Chicago Bulls -- he shot 52.4 percent from three -- but there was no way he could take 22 shots per game with any efficiency. Jordan continued to excel even when confronted with the most difficult shots -- under duress, at the end of the shot clock, or both.
There's a similar relationship with quarterbacks. The idea that certain quarterbacks can only handle 20-to-25 throws per game with efficiency holds up in the data. Observe, the average yards per attempt given a certain attempt total (data includes all games since 2009):
Team Efficiency Rankings - Week 14
Very little movement this week.
Markov Model of Overtime
 Last week, Brian offered analysis on the new overtime format, particularly on fourth down decisions. The new OT format is inherently state based, as he mentions, and therefore can be modeled adequately by a Markov chain (thanks to some of the commenters for the idea). The Markov property, which essentially states that we only need the most recent event to predict future events, holds true. If we are in a sudden death state, we don't need to know whether both teams kicked field goals or who even received the opening kick in order to make a prediction about who will win the game.
The Set Up
In Brian's post, he discusses three distinct states: Opening of Overtime, The "Matching Field Goal" Drive (where teams get a chance to match or beat after a field goal), and Sudden Death. These will be referred to as Opening, Mid OT, and Sudden Death (SD) respectively from here on. In this Markov model, there will be 10 total states:
Sunday's Numbers Have Been Crunched
Attention All Offensive Coordinators
Fourth down and short in the middle of the field does not mean you need to run a goal line play with the jumbo package. The average play in the NFL gets 5 yards. What's the completion percentage for short passes in this league, like 75%?
Line up and just run a standard play. Use play action. Throw an intermediate or deep pattern once or twice a season to keep defenses honest. How about a bubble screen if the corners don't press. And if they do, let them get burned.
Do not telegraph your intent to plunge for the line of gain. That only makes the defense's job easy. Spread out and force the defense to defend the entire field and your success rates will improve. Punish the defense for crowding the line of scrimmage. Think of fourth and short as an opportunity to know exactly what the defense is going to do and take advantage of it.
On the goal line, it's different. There is very little of the field to defend, and yards gained beyond the goal line are irrelevant. Jumbo packages and plunges make a lot more sense.