
 I was at an NHL game the other night, and with the score 2-0 someone asked me, “So Mr. Win Probability, what’s the chance the Capitals win?” I was caught off guard, and after I choked out, “I…don’t…know…,” I experienced the horror that is not knowing the exact up-to-the-second win probability of a sporting contest. Don’t let this happen to you.
The anxiety and shame lasted for two days straight. I kept blaming myself and replaying the incident over and over in my head. The only way to cure my depression was to build a win probability model for NHL hockey.
Unlike my previous models for basketball and football which were empirically based, my hockey model is theoretical. In other words, instead of being based on a massive database of actual previous games, the probabilities are calculated based on a Poisson scoring distribution. The distribution is calculated using the average goals scored per minute in the 2008-9 NHL season. It’s an extension of the model I developed in this post.
Teams score an average of 2.79 goals per 60 minutes of regulation time, which is equal to 0.0465 goals per minute. A Poisson distribution based on that per-minute scoring rate and the time remaining in the game yields the probabilities of each team scoring each number of possible goals by the end of the game. Summing up all the probabilities of all the possible combinations of final scores gives the game’s win probability.
Here’s the graph:
There are a couple wrinkles to address. First, there are power plays. When a team as a man advantage on the ice, it’s much more likely to score. About one in five power plays results in a goal for the team with the advantage. Only about 2% of the time the short-handed team will score. So at the start of a power play, a rough approximation would put the win probability a little less than one fifth of the way toward the next best curve.
For example, if the score is 2-0 with 30 minutes remaining in the game, the win probability would normally be about 13% for the trailing team (the red line). But at the beginning of a power play, the trailing team’s win probability would jump about a fifth of the way up to the ‘down by 1’ line (blue). A rough approximation puts the new win probability at 16%. Then as the power play expires and there’s no score, the win probability would gradually return to the ‘down by 2’ line.
Second, there is the ‘end-game,’ when teams down by a goal will pull their goalie in favor of an additional skater. That would increase the win probability of the trailing team slightly, but only half as much as you might expect. They’d still only be buying an opportunity in overtime. But it could still be factored in. Before I do, I’d need some data on end-game goals.
One advantage of a theoretical approach over an empirical model is that team strength can be factored in far more easily. In an empirical model, when you divide up the data by various classes of team strength, the data is sliced into tiny fragments, usually with very small and unreliable sample sizes. Theoretical formula-based models don’t suffer from that problem. I can simply adjust the mean goals scored and goals allowed for any particular opponent, then rerun the model. The resulting model would be tailored to the specific match-up instead of a generic model for the league as a whole. Home ice advantage can be factored in with a similar approach.
Remember, WPD (Win Probability Dysfunction) can happen at any time, and it’s nothing to be ashamed of. Don't analyze win probability graphs if you take nitrates, often prescribed for chest pain, as this may cause a sudden, unsafe drop in blood pressure. Discuss your health with your doctor to ensure that you are healthy enough to view win probability graphs. If you experience chest pain, nausea, or any other discomforts during a sporting contest, seek immediate medical help. In the rare event of viewing win probability graphs more than 4 hours, seek immediate medical help to avoid long-term injury.
Live NHL win probability graphs now online.
NHL In-Game Win Probability
Are Rookies Overpaid?
 I recently looked at what might explain why the top draft picks are paid disproportionately to their expected performance compared to later picks. But that doesn't address the larger issue--are rookies overpaid compared to their veteran counterparts?
A 2005 research paper called The Loser's Curse by economists Cade Massey and Richard Thaler tackled that question. In a nutshell, the paper compares rookie pay to the pay of a 6th-year veteran who could be expected to deliver the same performance as a rookie from each slot in the draft. (Performance is defined by a mix of measures including: being on a team roster, starts, and Pro Bowls.)
The conclusion of the paper is that team executives and scouts overpay for the top picks in the draft relative to the later picks, likely due to overconfidence in their ability to identify the best players. But what might surprise some readers is that rookies at every level of the draft are bargains compared to equivalently performing veterans.
This graph from the paper is the study's bottom line. The red 'compensation' line is the average annual pay for each draft pick. The blue 'performance' line is the salary a team would have to pay a 6-year veteran free agent for the same expected performance. The green 'surplus' line is the difference between the two pay levels.
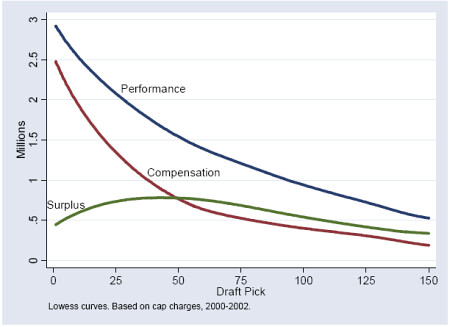
The surplus performance peaks shallowly at the bottom of the first round and through the second round. That's where teams get the biggest bang for the buck. But still, the surplus is strongly positive throughout the entire draft. According to Massey and Thaler, rookies are a bargain compared to veterans.
There's a good explanation why rookies would be underpaid. Veterans are known quantities while there is a tremendous amount of uncertainty with draft picks. Think of it this way--Peyton Manning has been to nine Pro Bowls and Ryan Leaf to zero, for an average of 4.5 between the two players. Four Pro Bowls--that's not bad. But would a GM pay more for a guaranteed 4.5 Pro-Bowl-type player or for a 50/50 shot between a total bust and Hall of Famer? Just about every modern economic and psychological theory tells us that people will pay a premium for the sure average.
Unfortunately, that's not an option in the draft. Peyton Leaf just doesn't exist. But 6-year veterans do, and GMs will be willing to pay a premium for the reduced uncertainty in performance.
One note of caution on the paper. The draft years studied were 2000-2002, and rookie salaries have increased substantially since then. But veteran salaries have too. The question is whether rookie pay increases have outpaced veteran pay increases since then. However, rookie pay would needed to have increased over 15-20% faster than veteran pay to change the conclusions of the paper.
Draft Success by Team
 Some teams and GMs have built reputations as good drafting teams, while others have earned the stigma of, well, as Mel Kiper says of the Jets, "not understanding what the draft is all about." What about your team? How have they fared in recent years?
I crunched some numbers for picks from the 1996 through 2008 drafts. To be honest, I chose 1996 because that was the first year of the "Baltimore NFL Franchise," the team yet to become the Ravens later that year. But '96 also makes sense because it's soon after the salary cap system was put into place, and players from that draft are still enjoying success in the NFL today. For the purposes of this article, I'm defining draft success as player years as a team's primary starter, and total number of Pro Bowl selections. Neither measure is perfect, but together they'll give us a pretty good idea of which teams have recently enjoyed the most successful drafts.
The first table lists the average number of years as a starter for each team's picks, broken out by round. For example, Indianapolis's first round picks have averaged 6.5 years as a starter. The average column is the average starting years for all a team's draft picks.
(Click on the table headers to sort.)
| Rank | Team | 1 | 2 | 3 | 4 | 5 | 6 | 7 | Avg |
| 1 | 6.5 | 3.5 | 0.9 | 2.2 | 0.7 | 0.7 | 0.9 | 1.9 | |
| 2 | 3.9 | 3.3 | 2.1 | 2.3 | 0.7 | 0.7 | 0.7 | 1.9 | |
| 3 | 6.0 | 2.7 | 0.6 | 2.1 | 1.5 | 0.8 | 0.0 | 1.9 | |
| 4 | 4.8 | 3.7 | 1.1 | 1.5 | 1.3 | 0.3 | 0.5 | 1.8 | |
| 5 | 3.9 | 3.3 | 2.5 | 1.0 | 2.0 | 0.5 | 0.4 | 1.8 | |
| 6 | 4.1 | 3.4 | 1.8 | 1.3 | 0.2 | 1.4 | 0.4 | 1.8 | |
| 7 | 4.2 | 1.6 | 2.4 | 2.3 | 0.4 | 0.5 | 1.4 | 1.7 | |
| 8 | 3.3 | 2.5 | 1.8 | 1.5 | 1.1 | 1.8 | 1.0 | 1.7 | |
| 9 | 4.2 | 2.2 | 1.6 | 0.2 | 3.0 | 0.6 | 0.3 | 1.7 | |
| 10 | 5.0 | 1.9 | 1.9 | 1.8 | 0.8 | 0.1 | 0.8 | 1.7 | |
| 11 | 4.9 | 2.8 | 1.8 | 1.3 | 0.4 | 0.2 | 0.8 | 1.7 | |
| 12 | 4.9 | 2.8 | 1.8 | 1.1 | 0.9 | 0.6 | 0.7 | 1.7 | |
| 13 | 3.1 | 3.0 | 2.4 | 1.7 | 1.2 | 0.9 | 0.3 | 1.6 | |
| 14 | 3.5 | 3.3 | 1.8 | 0.9 | 1.1 | 0.6 | 0.7 | 1.6 | |
| 15 | 4.2 | 2.8 | 1.9 | 1.2 | 0.9 | 0.5 | 0.6 | 1.6 | |
| 16 | 2.7 | 3.5 | 1.9 | 0.7 | 0.2 | 1.4 | 1.0 | 1.6 | |
| 17 | 3.9 | 3.2 | 1.5 | 1.3 | 1.3 | 0.5 | 0.4 | 1.5 | |
| 18 | 4.3 | 2.5 | 2.8 | 1.6 | 0.9 | 0.2 | 0.2 | 1.5 | |
| 19 | 3.6 | 3.0 | 1.5 | 1.2 | 0.9 | 0.9 | 0.6 | 1.5 | |
| 20 | 4.3 | 1.9 | 1.3 | 1.0 | 0.6 | 1.0 | 0.1 | 1.5 | |
| 21 | 3.7 | 2.5 | 1.2 | 1.3 | 0.3 | 1.0 | 0.6 | 1.5 | |
| 22 | 2.8 | 4.2 | 1.2 | 1.1 | 0.5 | 0.7 | 0.4 | 1.5 | |
| 23 | 3.6 | 3.0 | 2.9 | 1.1 | 0.8 | 0.6 | 0.0 | 1.4 | |
| 24 | 3.3 | 2.8 | 0.8 | 2.1 | 0.4 | 0.2 | 1.3 | 1.4 | |
| 25 | 4.1 | 1.8 | 1.3 | 1.7 | 1.2 | 0.1 | 0.6 | 1.4 | |
| 26 | 2.0 | 3.5 | 2.2 | 1.0 | 1.4 | 0.4 | 0.3 | 1.4 | |
| 27 | 3.8 | 2.3 | 1.2 | 1.5 | 0.5 | 0.6 | 0.2 | 1.4 | |
| 28 | 2.9 | 2.8 | 2.7 | 1.2 | 0.6 | 0.1 | 0.3 | 1.4 | |
| 29 | 3.7 | 2.9 | 1.9 | 0.9 | 0.6 | 0.4 | 0.3 | 1.4 | |
| 30 | 3.6 | 2.5 | 0.7 | 2.4 | 0.1 | 0.8 | 0.1 | 1.3 | |
| 31 | 3.7 | 2.0 | 1.4 | 0.0 | 0.6 | 0.2 | 0.4 | 1.3 | |
| 32 | 3.2 | 2.5 | 2.0 | 0.9 | 0.8 | 0.1 | 0.2 | 1.2 | |
| Avg | 4.0 | 2.8 | 1.7 | 1.4 | 0.9 | 0.6 | 0.5 | 1.6 |
The next table lists the total number of Pro Bowl selections for each team, broken out by round. Baltimore has had a total of 39 Pro Bowl selections by players they have drafted in the first round. (Note that some of the total numbers for the Browns and Texans will be low simply due their entry into the league in '99 and '02 respectively. The Lions are still worse, despite being in the league for the full time span.)
| Rank | Team | 1 | 2 | 3 | 4 | 5 | 6 | 7 | Total |
| 1 | 39 | 0 | 0 | 1 | 2 | 3 | 0 | 45 | |
| 2 | 32 | 3 | 1 | 0 | 1 | 2 | 0 | 39 | |
| 3 | 14 | 8 | 9 | 0 | 2 | 0 | 0 | 33 | |
| 4 | 18 | 2 | 10 | 1 | 0 | 0 | 0 | 31 | |
| 5 | 21 | 4 | 4 | 0 | 1 | 0 | 0 | 30 | |
| 6 | 10 | 8 | 8 | 1 | 0 | 1 | 1 | 29 | |
| 7 | 10 | 3 | 11 | 1 | 1 | 0 | 0 | 26 | |
| 8 | 9 | 6 | 1 | 3 | 1 | 4 | 1 | 25 | |
| 9 | 19 | 1 | 2 | 3 | 0 | 0 | 0 | 25 | |
| 10 | 4 | 6 | 1 | 1 | 3 | 6 | 3 | 24 | |
| 11 | 13 | 0 | 1 | 3 | 6 | 0 | 0 | 23 | |
| 12 | 1 | 8 | 6 | 0 | 7 | 0 | 0 | 22 | |
| 13 | 16 | 0 | 0 | 0 | 0 | 6 | 0 | 22 | |
| 14 | 8 | 9 | 0 | 2 | 0 | 1 | 1 | 21 | |
| 15 | 10 | 7 | 3 | 0 | 0 | 0 | 0 | 20 | |
| 16 | 7 | 2 | 7 | 1 | 0 | 2 | 1 | 20 | |
| 17 | 12 | 4 | 2 | 1 | 0 | 0 | 0 | 19 | |
| 18 | 8 | 0 | 0 | 0 | 11 | 0 | 0 | 19 | |
| 19 | 10 | 5 | 2 | 0 | 1 | 1 | 0 | 19 | |
| 20 | 4 | 6 | 7 | 0 | 0 | 2 | 0 | 19 | |
| 21 | 7 | 7 | 4 | 0 | 0 | 0 | 0 | 18 | |
| 22 | 15 | 2 | 1 | 0 | 0 | 0 | 0 | 18 | |
| 23 | 13 | 4 | 0 | 0 | 0 | 0 | 0 | 17 | |
| 24 | 13 | 1 | 1 | 1 | 0 | 0 | 0 | 16 | |
| 25 | 5 | 6 | 1 | 1 | 0 | 1 | 0 | 14 | |
| 26 | 7 | 5 | 0 | 1 | 0 | 0 | 0 | 13 | |
| 27 | 8 | 2 | 0 | 2 | 0 | 0 | 1 | 13 | |
| 28 | 8 | 1 | 0 | 3 | 0 | 0 | 0 | 12 | |
| 29 | 6 | 2 | 0 | 0 | 0 | 2 | 0 | 10 | |
| 30 | 7 | 2 | 0 | 0 | 0 | 0 | 0 | 9 | |
| 31 | 4 | 0 | 0 | 0 | 2 | 0 | 0 | 6 | |
| 32 | 3 | 3 | 0 | 0 | 0 | 0 | 0 | 6 | |
| Total | 361 | 117 | 82 | 26 | 38 | 31 | 8 | 663 |
But the tables above don't really tell us how well teams draft as much as it tells how high in the draft each team has picked. A team that consistently picks in the top third of each round will tend to end up with players with more potential, and therefore have better individual careers. So we need to account for each team's draft positions over the time period studied.
To do this, I calculated the expected number of starting years and expected number of Pro Bowls for each slot in the draft. After smoothing the data, I compared each team's expected draft success to their actual draft success. For example, the Detroit Lions' 1st round picks averaged 3.7 years starting, but they should have averaged a lot more given their typically high pick in each round. If we sum up the differences between expected and average for all the players, we'll see how well teams really drafted.
This table lists the 'Starting Years Above Expected' and 'Pro Bowl Selections Above Expected' for each team, given the picks they had during each draft.
| Rank | Team | St Yrs Abv Exp | PBs Abv Exp |
| 1 | 23.6 | 17.4 | |
| 2 | 17.3 | 1.7 | |
| 3 | 14.3 | -2.5 | |
| 4 | 13.6 | -2.1 | |
| 5 | 13.3 | -1.8 | |
| 6 | 11.8 | 0.2 | |
| 7 | 11.2 | 8.3 | |
| 8 | 10.4 | 6.3 | |
| 9 | 7.4 | -2.9 | |
| 10 | 6.4 | 4.4 | |
| 11 | 5.0 | -3.7 | |
| 12 | 4.8 | -2.9 | |
| 13 | 4.5 | 6.8 | |
| 14 | 4.1 | -3.6 | |
| 15 | 2.1 | 1.7 | |
| 16 | 2.1 | 1.4 | |
| 17 | 1.9 | 0.1 | |
| 18 | -0.8 | -3.9 | |
| 19 | -1.3 | -4.9 | |
| 20 | -3.2 | -0.8 | |
| 21 | -4.2 | -1.1 | |
| 22 | -5.2 | 3.8 | |
| 23 | -5.5 | -1.4 | |
| 24 | -6.7 | -2.5 | |
| 25 | -6.7 | 1.4 | |
| 26 | -10.8 | 0.4 | |
| 27 | -10.8 | -4.7 | |
| 28 | -15.7 | 1.1 | |
| 29 | -17.1 | 0.5 | |
| 30 | -21.0 | -1.2 | |
| 31 | -21.9 | -7.5 | |
| 32 | -23.0 | -8.0 |
It's important to note that none of this necessarily means certain teams or GMs are really any better than the others at identifying the best players. If the draft were completely luck, there would still be teams that look like geniuses and teams that get more than their share of busts.
In fact, that's one reason I'm building these tables. I'd like to find out how much variance there would be in draft outcomes due to luck alone, and then compare it to how much actual variance there is. The difference would the true drafting "skill" of teams, executives, and scouts. Is Ozzie really that good, or is he just lucky?