
The NFL’s website is getting on the data visualization bandwagon. They recently unveiled a project called ‘StatLab’ which involves two types of plots.
The first one isn’t terribly interesting. It just illustrates each division in terms of W-L record. The more wins, the bigger each team’s circle. This is a textbook lesson is when a table is better than a chart, but it’s a start. How about spicing it up with a dynamic chart that recreates the horserace of the season? Teams grow and shrink as the weeks click by. Or year-to-year improvement/decline in season records?
The other set of charts is more interesting and interactive. There are ‘radar’ charts for player statistics. Each stat is depicted as a ‘dimension’ or distance from the center of a plot. The better the stat, the further out the point. The points for each stat are connected and filled, so the bigger the shape, the better the performance. You can select a number of players to compare. The average stats are depicted for the selected position too. (Don’t show this to Joe Flacco’s agent. It’s amazing how close Flacco’s numbers hew to average in nearly every category. The one exception is interception total.)
New NFL.com Stat Viz
Sloan Sports Analytics Conference Update
Sloan is coming up this Friday and Saturday. I'll be part of panel consisting of Jack Del Rio, Herm Edwards, and Thomas Dmitroff. The title of the panel is Monday Morning Quarterback: Coaching and In-Game Decisions. The format will primarily involve looking at a variety of interesting situations from actual games. Tony Reali from ESPN will be the moderator, and it goes without saying that it should be fun. It's on Saturday afternoon, and is the keynote feature event of the entire conference. ...Ok, I made that last part up...It's actually on Saturday morning. If you won't be there, the panel will be featured via webcast.
If you're going to be at Sloan, please come say hi. (Please note that I'm not the former GM of the Toronto Maple Leafs.) Don't let my unapproachable scowl fool you. It's my first time there, and I'm looking forward to meeting as many like-minded analytics fans as I can.
Joe Flacco's Playoff Run Was Truly Elite (And Colin Kaepernick Was Pretty Good Too)
In January of 1990 -- the 1989 playoffs -- Joe Montana rattled off three straight incredible games. The 49ers legend compiled 800 yards on 65-of-83 passing (78 percent), fired 11 touchdowns and didn't throw a single interception. His five touchdowns and 297 yards paced San Francisco to a 55-10 demolition of John Elway's Denver Broncos in Super Bowl XXIV. The performance capped what remains the best postseason ever from a quarterback.
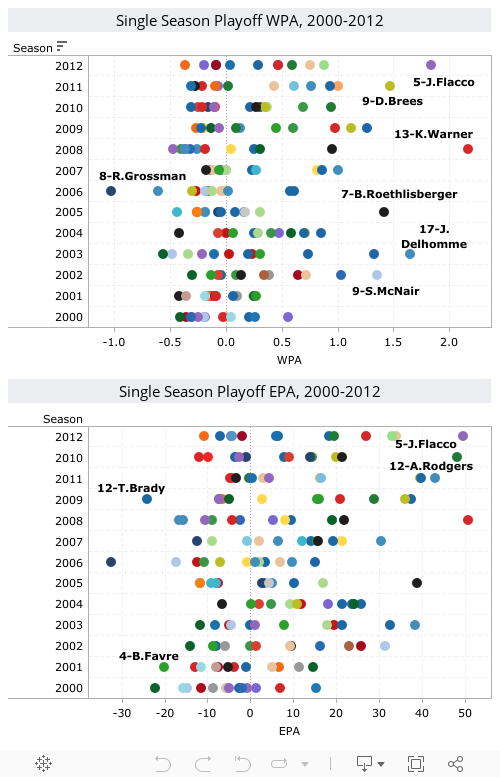
Joe Flacco's January and February of 2013 didn't eclipse Montana's accomplishments, but he arguably came as close as anybody in the 23 years since, and almost certainly closer than any other Super Bowl winner. Flacco did it in one extra game and 43 extra pass attempts, but he matched Montana's playoff record 11 touchdowns (also shared with Kurt Warner in the 2008 season) and zero interceptions. His 1,140 yards rank third all-time, just behind Warner and Eli Manning in last year's playoffs.
We only have WPA and EPA data dating back to the 2000 season, but Flacco's playoff run ranks second in both to Warner, and tops of any Super Bowl winner:
More SB 47 Analysis

Matt kindly sent his own analysis, using the 4th down and win probability calculators. This is exactly what those calculators are for...so I don't have to do all the work! Take it away, Matt:
In a Super Bowl with colossal storylines, including the impending retirement of Ray Lewis and a 34-minute blackout delay, the battle of the Harbaughs was arguably the biggest. Both coaches are considered among the league’s elite, and there won’t be much criticism of either of them following such a well-played season by both the Ravens and 49ers. In the Super Bowl, however, there were a few decisions made by the Harbaugh brothers on 4th down that significantly decreased their respective teams’ chances of winning.
Slate/Deadspin: The Little Things that Cost the 49ers

Live Super Bowl Win Probability and Chat
Join the crowd and follow the in-game win probability here. Throw in your two cents with the chat/comment feature.
2012 ANS Awards

As always, WPA and EPA will be my measure of performance, rather than yard or sack totals. I'm going to look at how each player stacks up against their peers at the same position. The idea is a little like the concept of the replacement player. The most valuable player would be the one that offers the most value above the next best alternative. Still, because the effect of the passing game is so magnified in today's game, this would always be the number one QB. So let's put each position on the same level and see who most stands out above the pack.
Rather than stare at an eye chart of numbers, I made a visualization that plots the top 32 performers at each position. Each player's total WPA is plot on the vertical axis and total EPA is plot on the horizontal axis. I'm not looking at over- or under-performance like when we were looking at 'clutch' play. In this analysis, I'm just looking for the players who show up at the top right of the plot. All numbers are from the regular season only.
There are two additional tabs that simplify things a bit by ranking each player by WPA and by EPA.
And because it's easy and fun, I've included past years too. You can even select 'all years' and see the top 32 at each position since 2000. The WPA Rank and EPA Rank bar charts are especially cool because they identify performance on multiple teams according to team color.
Regular vs. Post-Season QB WPA and EPA

For example, Kerry Collins' 2002 post-season stands out in that he dramatically out-played his regular-season self. (It was only one game, but Collins was absolutely heroic in what was one of the most heart-breaking miscues in playoff history. With only a minute left Collins drove the Giants to the SF 23. A botched snap cost New York the game.)
On the other side of things was Tony Romo's 2006 loss to Seattle. Again, a bobbled snap cost the (anti-) hero the game. (Special teams plays are usually excluded in these kinds of analyses, but the play was technically a Romo run.)
Note that Joe Flacco's current playoff run ranks as the eighth biggest over-performing post-season (so far).
Hover over each point to reveal the QB-year. You might want to make use of the zoom controls.