Super Bowl Game Probability and Voodoo Analysis


The game probability for the Super Bowl is up at the New York Times' Fifth Down.

This week I talk about momentum and 'voodoo' analysis:

A boulder rolls down a hill and gains momentum. A spark sets a fire, and soon it has built into a blaze. The rains come and soon the river is rushing over its banks. Momentum is everywhere in nature, but applying it to abstractions like team win-loss records in a relatively small sample of football games is what I call voodoo analysis.

Voodoo analysis is the application of apparently intuitive patterns beyond their natural settings. A football team is not a boulder rolling down a hill. It’s not a river bursting through a damn. It’s not a spreading fire. Our brains are continuously looking for patterns like these, and often see them even when they’re not there. That’s why we’re better off taking a disciplined look at the numbers from the full season.

Super Bowl Statistical Matchups

Here is your one-stop shop for all things advanced stats for SB 47. Team efficiency stats. Advanced team stats. Top individual performers from each team.

Clutch Persistence?

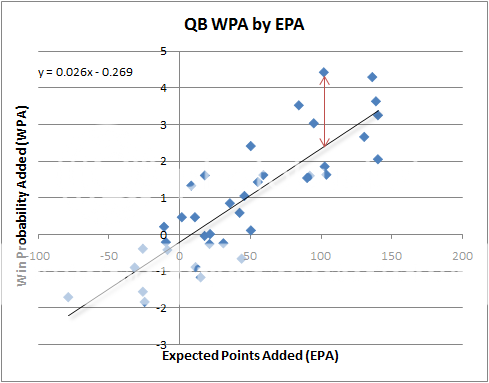
I recently wrote about clutch QB performance in the post-season. This post will take a look at clutch QB performance in the regular season and how well it persists from year to year. The approach is to compare how well a QB performs in high-leverage situations to how well he performs without respect to leverage. To do this, we can compare his Expected Points Added (EPA) to his Win Probability Added (WPA). This involves computing an "expected" WPA for each QB's season based on his EPA. The difference between a QB's actual WPA and his expected WPA could be considered his "clutch-WPA."

Here is a graphical depiction of what I'm talking about. This chart is from a 2010 article on clutch play. The vertical distance between a QB's expected WPA and his actual WPA, shown as the red line below, is clutch-WPA.


For this analysis, I used per-play metrics: EPA per play, WPA per play, and clutch-WPA per play. Only QB seasons with greater than 200 pass attempts were included.

To estimate "persistence" I measured the year-to-year correlation in our three variables of interest. The idea is that the stronger the correlation, the more persistent the measure is as a quality of that QB. If there is no year-to-year correlation, then the variable may only be random.

The table below lists QB year-pairs and their correlation in our three variables of interest. The 'n' column lists the number of year-pairs in the analysis. For example, the  1 - 2 row represents the 90 cases of first and second seasons each QB appears in the database. The database begins in 2000, so year 1 does not necessarily represent a QB's rookie season or his initial season with 200 attempts. (Note that both seasons in each year pair had > 200 pass attempts.)

Clubs Stay Conservative In No Man's Land

Initially, I was surprised Bill Belichick elected to punt last Sunday on a 4th-and-8 from Baltimore's 34-yard-line. Belichick's Patriots were up by six, and Belichick of all coaches should understand a six-point lead in today's NFL is far from safe. The decision was far from a no-brainer, as Keith sketched out last week.

But those calculations use generic odds; Belichick had his staff's play calling and Tom Brady's arm on his side. As well as his defense had played in the first half, it was still the 29th-ranked squad by efficiency entering the game. Joe Flacco and the Ravens offense, although mediocre overall, showed an ability to pick up large plots of yardage in just a few plays. The difference between handing the Ravens the ball at their 34 or around their 10 (Baltimore fair caught the eventual punt at the 13) seemed worth risking for the Patriots in order to maintain possession.

Of course, the Ravens proceeded to drive 87 yards as Joe Flacco dissected New England with a 13-play no-huddle masterpiece of a drive. Baltimore took a 14-13 lead and wouldn't relinquish it.

Belichick is a risk-taker, indeed -- even if he softens up between now and his retirement (assuming whatever form he takes on this earth is subject to human aging), his famous decision to go for it on a 4th-and-2 in his own territory against Indianapolis in 2009 cemented that legacy. If Belichick wouldn't try in that situation -- one we suggest is a toss-up, slightly favoring a conversion attempt -- who would?

Unsurprisingly, attempting to convert a 4th-and-8 between the 30 and 40 outside of the fourth quarter isn't just outside the limits of Belichick's courage. NFL teams faced the situation 15 times this season (including playoffs) before Belichick faced it last Sunday, and 15 times the teams kicked -- four punts and 11 field goals, with just six successful.

4th-and-8 happens to be a convenient example -- teams at least tried once on everything else from 4th-and-1 through 4th-and-11. But coaches shy away from attempting any fourth down longer than one yard, and anything longer than three is treated like the plague (looking at just the first three quarters to try and eliminate desperation attempts).

Coaches tried for the first down over 75 percent of the time on 4th-and-1, but an extra yard scared away half those brave souls. For some reason, teams almost never attempted with between six and nine yards to go, but were more willing to risk the fourth down attempt (although I would suggest punting is a risk as well, as the Patriots found out) with 10 or 11 to go.

Here are the plays separated out into individual blocks, with wide blocks representing successes and narrow ones representing failures. You can mouse over the individual blocks for a description of the play:

Who's the Clutchiest Post-Season QB?

What does clutch even mean? To me clutch means someone who has over-performed his typical expected level of performance in high-leverage situations. A great QB who plays equally well in clutch situations as he does in other situations isn't 'clutch' to me. But a guy who raises his game in high-leverage situations can be called clutch.

The ability to over-perform in clutch situations as a persistent skill almost certainly does not exist. (More on this in a future post on year-to-year correlations in general performance levels and clutch performance levels.) But that's not to say that some players' better moments happened to have occurred when things mattered the most. Although clutch as a quality or skill does not exist, clutch as an event certainly does.

Trying to define clutch is a tricky business. It's an arbitrary exercise with no one correct answer. Should we count situations where a team is down one score or two? With 5 minutes left to play? 4 minutes left? The final 10 minutes of a game?

My solution is to compare a player's Expected Points Added (EPA) with his Win Probability Added (WPA). EPA measures total production without respect to time and score. In contrast, WPA is heavily weighted by game situation. Players whose WPA exceeds what we'd expect based on their EPA could be thought of as clutch, and players whose WPA is below what we'd expect could be considered anti-clutch.

Patriots Primarily Punt on Fourth Down

Bill Belichick is known for being one of the greatest football minds in NFL history. He's also known for being one of the "riskiest" play-callers -- riskiest in quotes to emphasize that he actually plays to the odds rather than most of the conservative football minds. Down 28-13 in the AFC Championship game, avid Patriots fan Bill Simmons put it best: "Ravens playing to win, Pats playing not to lose."

Belichick faced eight fourth downs in the game against the Ravens, seven of which were legitimate questions for the best course of action: Go for it, punt or kick the field goal. Whereas we would normally expect Belichick to be aggressive, he seemed more reserved in his decision-making. There are a ton of factors that could explain his passive play-calling. For example, it was extremely windy making field goals more difficult and maybe Belichick did not have faith that Joe Flacco could sustain a 90-yard drive due to the Ravens boom-or-bust offense (the Ravens ended up with three scoring drives of 10+ plays including a 90-yarder and 87-yarder).

Let's look at each fourth down decision, starting with the very first. Remember in the beginning of the game, especially if the score is fairly close, we should look at expected points, but as score and time become bigger factors, we will switch to win probability. Also, note that these are league baselines. The fact that the Patriots offense is No. 1 in the league and far above league average would indicate a higher success rate on 4th-down conversion attempts.

Feature Enhancement: Time Calculator

The Time Calculator is a tool that will estimate the time remaining in a game that a trailing defense can expect to get the ball back if they force a stop. It considers the current time and timeouts remaining while factoring in stoppage from the two minute warning and change of possession.

The previous version of the Time Calculator could only base its estimate beginning with the time of the first down snap of a series. For the vast majority of situations that's ok, because offenses will typically only run plays that avoid stopping the clock--runs that stay in bounds. But sometimes there is a stoppage, due to either an incomplete pass,a runner going out of bounds, penalty, or other reason.

The old calculator could account for an unexpected stoppage if you add a notional timeout to the game state. For example, say the defense began the series with 1 timeout, then used it following 1st down, and there was an unexpected stoppage after second down. This scenario would be no different than if the defense began the series with 2 timeouts rather than their actual 1.

Still, it would be easier and more straightforward to make the calculator work for any down. Now you can enter the time at the snap of any down in a series along with the number of timeouts remaining, and the calculator will estimate the time after the change of possession.

All the other options remain the same: the average duration of each play, the game-clock duration between plays, and whether the defense would prefer to trade away some time on the clock to preserve a timeout for use on offense.

Try it out. The Advanced NFL Stats Time Calculator.

Against Colin Kaepernick, Pick Your Running Poison

Questions about Colin Kaepernick's ability to lead the 49ers in the playoffs were brushed aside with alacrity in last Saturday's emphatic victory over Green Bay. Kaepernick dominated the game from start to finish, landing blow after blow with his legs until a 56-yard touchdown run sent the Packers packing back to Wisconsin and broke the quarterback playoff rushing record in the process.

As Brian noted at the New York Times's fifth down, Kaepernick is the main reason San Francisco gives a substantial 4.5 points at the Las Vegas books despite playing at top seeded Atlanta in the NFC Championship. The 49ers' solid conventional running game and excellent defense would have made them a formidable matchup for the ever-questioned Falcons with Alex Smith under center. Kaepernick's dynamism in the running game makes San Francisco a nightmare.

The zone read and other designed quarterback running plays -- such as those out of the pistol formation -- have used Kaepernick's speed in a wildly successful fashion. Including the victory against Green Bay, Kaepernick has used designed runs 35 times and picked up 351 yards and 21 expected points added, an absurd 0.6 expected points added per play. Marshawn Lynch had 19.6 expected points added this season on 315 rushing attempts.

Kaepernick piles on the big plays. Only 41.4 percent of rushing plays have gone for a positive EPA and only 9.2 percent have gone for more than plus-1.0 EPA. Among just Kaepernick's designed runs, 57.1 percent have been positive by EPA. Most impressively, 11 of his 35 (31.4 percent) have been worth at least a full expected point added; four of the 35 (11.4 percent) have been worth more than three.


But, even if the Falcons can stop Kaepernick out of the pistol or zone read or other designed runs -- and they haven't stopped quarterbacks running yet this year -- they still have to deal with his legs after he drops back to pass.

Kaepernick's passing ability is dangerous enough -- including the playoffs, his 6.7 AYPA leads the league. Add in his legs and it makes truly covering the field nearly impossible. Kaepernick has busted out of the pocket 29 times for 244 yards, picking up 8.4 yards and 0.39 EPA per scramble.

Don't Overlook the Effect of Penalties

One of the more overlooked aspects of team performance is the tendency for being penalized. Penalty rate, defined as penalty yards per snap is one of the more reliably stable team stats. Compared to things like running or passing efficiency, the absolute size of penalty rate's effect is small, but because it tends to be consistent, it can be fairly predictive.

This Sunday's conference championship games feature teams on opposite sides of the penalty spectrum. ATL has by far the league's lowest team penalty rate at 0.21 penalty yards per snap. For context, the league average is 0.41, and the next best team is NYG at 0.29. ATL is 3.9 standard deviations better than the 2012 mean! SF is third worst in the league 0.46 penalty yds per snap.

On the other side of things is BAL. They're averaging 0.53 penalty yards per snap, the league's worst rate. That's 1.9 standard deviations worse than the mean. NE is tied for 6th best, at 0.39 penalty yds per snap.

Conference Championship Game Probabilities


Game probabilities for the conference champtionship games are up at the New York Times' Fifth Down.

This week I estimate the value of Colin Kaepernick over Alex Smith in terms of their effect on the probability of winning.


When to Intentionally Allow a TD When Tied

Super Bowl 32 was a memorable one. A tight game featuring John Elway and Brett Favre would have made a memorable regular season game, but as a Super Bowl it was spectacular. To me the most interesting thing about the game was how the winning score happened. It was allowed intentionally.

The game was tied at 24. The Broncos began a drive with 3:27 left to play. After a big Elway pass and several Terrell Davis runs, Denver put Green Bay in the Field Goal Choke Hold. Eventually, Denver fought its way to a 1st and goal from the Green Bay 8. A holding call on Shannon Sharpe moved Denver back to 1st and goal from the 18. Another Davis run set up 2nd and goal from the 1 with just 1:47 to play. Rather than allow Denver to run down the clock any further, head coach Mike Holmgren elected to allow the TD on the next play to give his offense a better chance to respond with a TD of their own.

In the wake of my previous five-part analysis of intentionally allowing a TD, I learned what the Internet jargon tl;dr stands for. I promise to make this one shorter. Previously, I looked at situations in which an offense that's trailing by 1 or 2 points could run out the clock before kicking a field goal to win. In many cases, depending on the time, score, field position, and number of timeouts remaining, it makes sense for the defense to allow a TD rather than try to force a stop and a FG attempt.

This time I'll examine similar situations where the score is tied. The considerations are a little different than when the defense has a 1 or 2 point lead. A tie score means that the defense can't be relatively assured of a win in the event of a miss. And given a successful FG to break a tie, a FG in response only re-ties the game.

The Seahawks' 4th and 1

Pete Carroll is getting a lot of grief today about going for it on 4th and 1 from the ATL 11 in the 2nd qtr. It was the slam-dunk right call, which I'll explain below. But worse, much of the criticism is completely misguided. I would, however, knock SEA for the play call.

I keep reading and hearing about how the failed 4th down attempt 'came back to bite Seattle' or that the decision cost 3 points in a game decided by 2. First of all, that's complete outcome bias. Expunge that kind of thinking from your head. Had SEA converted, the same people who are now critical would be praising Carroll for his courage. Second, you can't simply append 3 extra points onto the final score and say that would have changed the outcome. You never know how the game may have unfolded had Carroll decided on the FG attempt. Both teams would have played at different risk levels and at different paces had the score been different, particularly in the endgame.

I've refrained from the cookie-cutter 'should have gone for it, coach' posts this season for fear of becoming a one-trick pony. (Especially now that everyone can do the same thing himself with the 4th Down Calculator.) But this was a critical call in an important game, so I'll indulge. Here are the numbers on the 4th down itself. Remember, results are based on league average baseline numbers. It was 4th and 1 on the ATL 11 with 5:38 in the 2nd qtr. ATL was up 13-0.

Slate/Deadspin - John Fox Gets Conservative

A dissection of John Fox's series of conservative decisions during Saturday's playoff game between the Broncos and Ravens.Did his decisions make the decisive difference in the game?

NFL coaches will often refer to “playing the percentages.” But if there's one thing I've learned by studying strategic decisions, it's that coaches don't have a firm grasp of those percentages. And when anyone is uncertain of the odds, he'll fall back on the sure thing. That was the case with Broncos coach John Fox, who opted for the conservative approach at almost every opportunity in Saturday’s playoff game against the Ravens. Even so, Fox is getting more criticism than he deserves...

...There was also the matter of Peyton Manning's arm. For whatever reason—possibly the cold weather having some effect on his grip—Manning did not appear to have the velocity needed for deep passes. Only 2 of his 43 attempts went more than 15 yards downfield. (Quarterbacks typically throw about 20 percent of their passes deep downfield, and Manning averaged 19 percent in the regular season.)
Here's the Deadspin link.

Best Games of 2012 and Best Playoff Games

With the barn-burner in Denver still echoing in our minds, not to mention the SEA-ATL double comeback, I thought it would interesting to see where it stacks up against other games this year. Measuring how 'good' a game isn't science. Everyone has their own interpretation of how entertaining a game is.

I like to rely on a couple simple measures of how entertaining a game is, Excitement Index (EI) and Comeback Factor (CBF). From the Glossary:

Excitement Index (EI) – The measure of how exciting a game is. EI measures the total movement of the Win Probability (WP) line during a game. The more that WP fluctuates, the more dramatic, uncertain, and exciting a game is.

Comeback Factor (CBF) – The measure of how big a comeback is in a game. CBF is defined as the inverse of the winning team’s lowest Win Probability (WP) during a game. For example, if a winning team’s lowest point in a game is 0.10 WP, its CBF would be 10, which is 1 / 0.10. The higher the CBF, the bigger the comeback.
The 'Best Games' tool on the site is one of the hidden treasures of ANS (in my opinion). For instance, it tells us that the BAL-DEN game ranks as the 5th most exciting game of the entire season.  It's also the most exciting game for the both the Broncos and the Ravens in the database (since 2000). And with a CBF of 50, the game ranks behind just 7 games this season with an even more improbable outcome.

Broncos Botch Final Drives

The Broncos were heavy favorites at home against the Ravens on Saturday. Peyton Manning and company had won 11-straight and were the favorite to take home the Lombardi trophy. Ray Lewis and Mr. Elite himself, Joe Flacco, had other ideas in mind. Despite being up a touchdown with the ball, having Peyton Manning on the field, and the Ravens out of timeouts at the two-minute warning, the Broncos gave the Ravens back the ball. Rahim Moore undercut a floater worse than any NFL safety should and Jacoby Jones walked into the end zone to tie the game.

In a tie game, the Broncos started their final drive on their own 20 with 0:31 seconds remaining and two timeouts in hand. John Fox says, "Let's take it to overtime" and has potentially the greatest quarterback ever kneel down instead of trying for the game-winning field goal. That wasn't the first time the Broncos made this mistake. In fact, they made an eerily similar gaffe at the end of the first half. After missing a field goal and allowing a long Torrey Smith touchdown, the Broncos received the ball at the 20 with 0:36 seconds left and three timeouts. John Fox ran the ball one time and headed to the locker room. The only real explanation is that Fox believes momentum has predictive power. His thought process was probably that after two huge plays from Baltimore, the only thing that could come from an attempted 30-second drive is a game-changing mistake.

Division Round Game Probabilities


Game probabilities for the divisional games are up at the New York Times' Fifth Down.

This week I break down the Seattle-Atlanta game. It should be a close one.


Altitude and Field Goals

Last season I looked at the effect of temperature on field goal success and saw that a 30-degree difference is approximately worth 5 yards of kick distance. A 40-yard attempt in 30 degree weather is like a 45-yard attempt in 60 degree weather. Much of the effect can be attributed to the increased air density in colder air. But what about altitude? How does the thin air of Denver's Mile High Stadium affect field goal success?

When it comes to altitude, there's Denver's 5,200 feet and then there's everywhere else. Phoenix is the next highest at about 2,000 feet, but it's almost twice as close to the sea level as it is to Denver. To compare apples to apples as much as we can, I compared Denver's FG success with that at other outdoor stadia. I excluded Arizona for the purposes of the comparison, and only included kicks in moderate temperatures from 41 to 80 degrees.

Remaining Eight Playoff Teams' EPA

I noticed an interesting thing about the eight remaining teams in the playoffs. They are currently the eight and only eight teams that are in the upper-right quadrant of the Team EPA visualization (on the main page or full viz here.) This means they are the only eight teams to have both an above average defense and offense for the season to date. The Colts, Bengals, Vikings, and Redskins were below average in one category or the other.

Announcement: 2013 MIT-Sloan Sports Analytics Conference

I've resisted attending conferences and other events like the league's rookie combine, but I've had a change of heart. I will be attending the MIT Sloan Sports Analytics Conference this March. And I'm proud to announce I've been invited to be a member of the football analytics panel, which I think will be a lot of fun.

The conference will be March 1-2 at the Boston Convention Center. I'm looking forward to meeting many of you there.


Coaches Bring Passiveness To Wild Card Weekend

I'm never quite sure what decision-making trends to expect out of the NFL playoffs. It seems any decision can be justified by the playoffs. "It's the playoffs," one of the exalted keepers of the true knowledge can say. "You have to leave it all on the line," he says as the coach keeps the offense on the field for a fourth and goal.

But, he could just as easily say, "You don't have a choice here. You have to live to fight another day." The field goal team trots out for a 20-yard chip shot instead.

The field goal teams were out in force for Wild Card Weekend. Presented with 27 fourth downs inside the opponent's 40 yard line, teams kicked 17 field goals, punted twice, and went for it just eight times. Of the 17 field goal attempts, only eight were the optimal win expectancy choice according to the 4th down calculator. All told, coaches left 0.24 of win expectancy and 6.3 expected points on the table with these decisions.

Overall, teams saw 66 fourth down plays and made the optimal decision 49 times. Only one of the 11 decisions to go for it was suboptimal (by Washington when they were already down by 10 late in the game) and seven of the 33 punts were as well. The biggest whiffs were typically in field goal situations, but to the coaches' credit, the kickers were sharp: they combined to convert 16 of the 17 field goals on the week.

Still, there were a few calls worth questioning even given the true kicks. After making a borderline call to go for it on fourth-and-5 from the 34 -- probably the right call given the unreliability of Mason Crosby this season -- and succeeding, the Packers kicked on a fourth-and-goal from the one yard line with 3:25 to go in the 2nd quarter. The Seahawks, up by seven against the Redskins, chose to kick on fourth-and-goal from the 4 with 5:32 to go in the game.

Peter King Podcast

I was a guest on Peter King's podcast at SI today. We talked about the role of analytics, RB impacts, and some overlooked performances of the season.

Wildcard Game Probabilities


Game probabilities for the wildcard games are up at the New York Times' Fifth Down.

This week I examine the whether the Colts' are as good as their record suggests.

Franchise Visualization Updated with 2012 Data

Curious about just how bad the Chicago offenses have been under Lovie Smith? Or how the Cardinals' production fell after Kurt Warner's retirement? What's the real reason for the Cowboys' recent disappointing seasons? Is it the Romo-led offense or the defense? Which rookie QB is responsible for the biggest improvement in their team's offense in 2012?

The answers can all be found in one place--the franchise visualization. The brainchild of Chase Stuart of Football Perspective, the franchise viz plots the offensive and defensive production, in terms of EPA, on an x-y plot for every team since the 2000 season.

With week 17 now in the database, the 2012 season has been added to mix. Happy visualizing!


2012 Team Efficiency Rankings - Final *Corrected*

Correction--There was a bug in the ointment the first time around posting the rankings this week. These numbers have been updated with the correct

There are a few sore thumbs every year in the rankings. A few weeks ago I wrote about how the then 2-8 Panthers were much better than their record indicated. Since then, they went 5-1 to finish 7-9. Do I think CAR is really the 4th best team in the league? No. But they were the 4th most efficient on offense and defense in 2012.

The following week I wrote about how the Ravens were a mystery. They were ranked 19th in the rankings but held a 9-2 record. I was grasping to explain their good fortune. Maybe no explanation was needed, as BAL went 1-4 since then. (1-3 if we throw out week 17's loss in fairness.)

It might seem like I'm cherry picking the model's 'hits' and ignoring its 'misses.' I'm obviously not pointing out how the model ranked PHI 2nd in its first iteration after week 3. Oops, I guess I just did. But it's not week 3 anymore, and we have a lot more information now.

There is one more sore thumb to be addressed. That's the 11-5 Colts, who are ranked 24th in efficiency. Their Generic Winning Probability (GWP) is 0.44, which if correct would make an 11-win record highly unlikely. It's very possibly they're better than 24th, but notice that their opponent average GWP is 0.46, so despite a low efficiency ranking, we should not be too surprised to see IND end up its winning record.

[Edit: 0.46 Opp GWP might not seem like much, but that's not far from the equivalent of having an additional home field advantage effect for every game, ...if that makes any sense.]

Play-by-Play Data for 2012 Regular Season Now Available

The link is here. Happy crunching.

Best of 2012

As has become tradition here at ANS, I'll look back at the year and round up all the best articles. (Here are the best of 2009, 2010, and 2011.) This annual post is as much for me as it is for readers for a couple reasons. First, I get to gaze upon the results of all the hard work myself, Keith, Jack, and other contributors have done. And second, it's a handy way to collect all the quality posts from the year in one place.

Each year I think it's finally the year that the site has peaked and all the low hanging statistical fruit has been plucked. But somehow things keep going strong. Jack and Keith provided lots of great game and player analysis plus some original research of their own. There were also some cool new features added to the site. Keep in mind, these are just a fraction of the 200 posts from 2012.

Starting with last January, Keith applied his Markov model to look at the drive that broke the Jets' 2011 backs.

I introduced two new features of the player stat visualizations--the QB career totals for EPA and WPA. The visualizations are a clever way to compare careers. The "Nth Best EPA" graph plots each QB's career in order of his best through worst seasons. The "Career WPA" graph plots each QB's cumulative WPA through each year of his career. These are a couple of my favorite new features at the site.

My contributions with Slate and Deadspin continued through the 2012 season. Here is a post that looked at some critical 4th down decisions in last year's playoffs and put the 4th down itself in perspective.

Jack is the king of the Tableau visualizations. Here is his analysis of how HOU beat CIN in last year's wildcard round.

This article was the culmination of a lot of research and analysis. Using EPA and WPA, I estimated the price of a win in terms of salary cap hit. This became a framework for evaluating contract values, and the article uses Drew Brees' recent contract as a case study.

The 'Dome at Cold' effect is well known to ANS readers. Here's a slightly more in-depth look at the climate phenomenon and how various types of road teams fare by temperature. Here are several more articles on how weather, including temperature and wind, affects passing, running, and field goals.