
The 'season-win' regression models I've used are linear. They estimate the straight-line increase or decrease in season wins based on the variables used in the model. But in reality, not all phenomena work that way. Linear relationships are very common, but many natural relationships are non-linear, or exponential. Consider, for example, compound interest rates--If you deposit $100 in an account that earns 5% each year, you'd have $265 at the end of 20 years. At 10%, you'd have a lot more than double that, about $673.
To see if any of the stats I've been using are related exponentially to wins, I created new variables that are the squares of the passing/running/turnover efficiency stats. By including the squared variables in addition to the original linear version, we can see if there is a significant exponential relationship which might produce a model with a better fit.
For example, we already know that more defensive interceptions produce more wins. But if the squared variable for defensive interceptions is positive as well, then we'd know that even more interceptions produce wins at a faster rate (assuming a direction of causation between interceptions and wins). If the squared variable for defensive interceptions is negative, then we'd know that although interceptions produce wins, there is a diminishing return when a team accumulates a lot of them.
Offensive passing efficiency is consistently the strongest factor in the season win models, so I tried a regression including its squared variable first. The results are listed below (r-squared = 0.74). The sqaured 'true' offensive passing efficiency variable (sq_TRUOPASS) is not significant, and the original linear version is no longer significant. By removing the squared variable, the model improves in several respects.
The complete model with all the efficiency stats, turnover stats, and penalities may be dividing up the variance of the dependent variable too finely, so I ran a simple model with TRUOPASS and sq_TRUOPASS only. The results are below (r-squared = 0.37). The significance is a little stronger, with TRUOPASS (linear version) being significant at the 0.10 level. But sq_TRUOPASS does not become significant. Perhaps more seasons of data would provide significance, but it is unlikely to improve the estimation very much.
Had the coefficients been significant, we could construct an equation to estimate wins based on the simple non-linear passing model. This would be represented as follows:
WINS = const + B1 * TRUOPASS + B2 * TRUOPASS^2
WINS = -11.9 + 4.4 * TRUOPASS - 0.18 * TRUOPASS^2
For example, on the strength of their passing offenses alone, the '06 Ravens would be estimated to have 9.01 wins, and the Super Bowl teams Chicago and Indy would have 8.4 and 11.3 wins respectively.
I repeated inserting squared variables for each efficiency stat, and the results were very consistent--none were significant. In addition, I repeated the analysis using logarithmic versions of each variable. Again, they were not significant. The bottom line is that it seems that the model is best (and simplest) when using strictly linear variables. Although the results are consistently nonsignficant, there tends to be a 'diminishing-returns' effect to the extremes of increasing and decreasing performance stats. This makes sense, because teams are bounded by 0 and 16 wins.
Non-Linear Estimators
Run/Pass Interaction
So far the models I've been using have been purely additive. That is, they tally up the independent effects of running efficiency, passing efficiency, etc. But the models have not yet addressed the interaction effect of running and passing together. In other words, is there a bonus to having both a good passing game and running game simultaneously that is not otherwise captured by the respective linear coefficients of passing and running efficiency? Call it synergy or a dynamic, but in statistics it's called an interaction.
To test the theory of an interaction effect between passing and running efficiency I created two new variables that are simply the product of passing and running efficiency for offense and for defense.
OPASSRUNIXN = OPASS x ORUN, and
DPASSRUNIXN = DPASS x DRUN
In regression models, the coefficients of interaction variables are only meaningful if the variables are standardized, which means they are in terms of how many standard deviations they are from the mean and not in terms of raw yards. For example, a team's very poor passing efficiency stat of 4.5 yds/att would be -2.2 when standardized, meaning it's 2.2 standard deviations below the league average. Using standardized variables, aka "Z-scores" also allows us to evaluate the relative weight of each regression coefficient directly. If a variable's coefficient is twice as large as another's, then it is related twice as strongly to the dependent variable.
Again, season wins is the dependent variable. The sample comprises all 32 NFL teams' stats from the 02-06 regular seasons. The independent variables include the familiar offensive and defensive: running, passing, interception, and fumble efficiencies, plus penalties. This time, we also include the two new interaction variables.
The result of the regression is below:

R-squared is 0.75.
First, let's review what the coefficients mean. Since the variables are all standardized, we can see that "ZOTRUPASS" (standardized offensive true passing efficiency) has a coefficient of 1.2. This means for every standard deviation above league average, a team can expect 1.2 more wins than if it were average--holding all other variables constant.
We also see that ZORUNAVG (standardized offensive running efficiency) has a coefficient of about 0.4. That means for every standard deviation above average a team is in running efficiency, it can expect 0.4 more wins than if it were average--holding all other variables constant. And because these coefficients are of standardized variables, we can say that the relationship between passing efficiency and wins is 3 times stronger than for running efficiency and wins.
The variables of particular interest now are the interaction variables (the bottom 2). ZORUNPASSIXN (standardized offensive run-pass interaction) is solidly significant and its coefficient is about -0.3. In comparison, the coefficient for running alone is about 0.4. This is evidence that there is something to the theory that there is a synergistic effect to running and passing, at least on offense. But it is completely opposite of what I expected. The stronger the interaction (i.e. the better the combination of running and passing), the fewer wins a team can expect. This indicates although running and passing well help teams win, there is a limit to the linear relationships between running and winning, and between passing and winning.
ZDPASSRUNIXN (standardized defensive pass-run interaction) is not at all significant and the coefficient is near zero. Excluding other variables from the model still does not make defensive run-pass interaction significant. This is evidence that there is no synergistic effect on the defensive side of the ball. I'm surprised because it makes intuitive sense that if a team can stop the run, the opposing offense becomes very predictable.
Defensive Penalties
In the last post, I discussed a new model for season wins based on some revised variables. Two new variables I added to the model were offensive penalties and defensive penalties.
The model shows that holding all other variables equal, the coefficient for defensive penalties is positive. This is unexpected. I redid several models, and anyway you slice it, more defensive penalties correlate with more wins--in terms of both number of penalties and penalty yards. Keep in mind that correlation does not equal causation, but it's hard to imagine why a team that is winning would be likely to commit more penalties when on defense. The effect is not severe, but it is definitely significant.
In contrast, offensive penalities correlate negatively with winning in all models. This makes sense.
What could the explanation be?
Revised Season Win Model
After refining pass efficiency and turnover stats, I redid the linear regression model for season wins as the dependent variable. (As a refresher, the regression model estimates season win totals based on relevant team stats.) R-squared for the model is 0.74, not any better than the previous model, but it is better in several other respects.
First, the true pass efficiency stats are used. The effect of passing game efficiency is captured more accurately. True pass efficiency counts sacks as pass attempts.
Second, turnovers are no longer lumped into one big 'net turnover' variable. Instead, each type of giveaway and takeaway is given its own variable which are per snap. For example, I use interceptions per pass attempt, defensive forced fumbles per rush/sack/completion, and offensive fumbles per rush/sack/completion. Although not as powerful as net givaway-takeaways, these 4 variables quantify the effect of each type of turnover on both sides of the ball.
Third, I've added a new variable to the model I haven't used before--penalties. Using either penalties or penality yards has roughly equal effect. Both offensive and defensive penalties are significant at the p=0.05 level. It doesn't add much to the goodness-of-fit of the model, but it does help rectify the problem of defensive run efficiency insignificance.
Defensive run efficiency becomes more significant in the model when penalties are added, and further as densive forced fumble rate is added. In this version of the model, defensive run efficiency (DRUNAVG) is now significant at p=0.05. I'll need help figuring out why.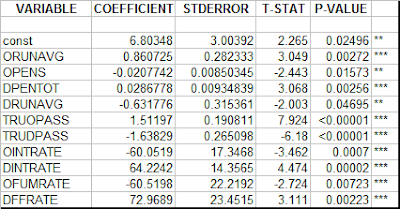 *** denote levels of significance
List of Stats and Correlations
I thought it would be interesting to list all the correlation statistics in one place. These are based on all 32 teams from each of the 5 seasons between 2002-2006. Each variable is listed here with its correlation with season wins, offensive points scored, and defensive points allowed. (0.15 for p=0.05 significance) The list is sorted 3 ways according to the strength of each correlation. Click on the tabs at the bottom of the page to sort the list according to the correlation you wish.
One caveat: some of the stats that are highly correlated with wins are not that useful. For example, extra points attempted' only tells us how many TDs a team scored. We already know that TDs are how you win in football. 'Kick return yards allowed' would be another example. The more TDs a team scores, the more total yards it will have given up on kickoffs.
Defensive Fumbles Forced
If fumble recoveries are random, should defenses be credited with fumbles or fumble recoveries that result from unforced fumbles? How would a defense induce an unforced fumble, such as a muffed snap or handoff? I'm guessing it can't.
So if unforced fumbles are not under the influence of a defense, and if recoveries are random, then a defense's ability to produce fumble turnovers should be measured by forced fumbles no matter who recovers them. And to be more precise, the best measure would be forced fumbles per play (in which a forced fumble is plausible, i.e. not incomplete passes).
If this is true, the win- and points- correlations with forced fumble (FF) rate will be higher than gross FFs, fumbles, or fumble recoveries. I would expect that fumble takeaways might still have the strongest correlations, but because recoveries are random, I believe that it does not estimate future fumbles as well as forced fumbles.
Here are the correlations:
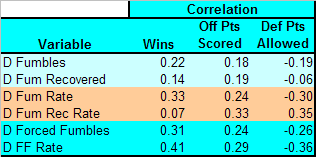
As it turns out, I was partially correct, but the forced fumble rate statistic turns out to be more powerful than anticipated. Not only does defensive forced fumbles have stronger correlations to wins and points than gross fumbles and fumbles recovered, the defensive forced fumble rate stat (FF per fumble-potential play) has the strongest correlation of all (0.41).
In summary, the data suggests I use 'defensive forced fumble rate' as the defensive fumble stat for a win-regression model. It also suggests (noted in previous posts) that I use offensive fumbles, and not offensive fumbles lost. These stats correlate relatively strongly with winning, points scored, and points allowed; they do not suffer from the random noise of fumble recovery; and, since they are 'per play' rate stats, they are not biased by the causation backflow discussed in the interception post.
Fumbles and Fumbles Lost
In the lost post I raised the question "Can the ratio of fumbles lost to fumbles tell us anything significant?" but did not address it. Here is an initial analysis.
For an offense, the ratio of fumbles lost to fumbles indicates how often the team is able to recover its own fumbles. The lower the ratio, the better the team is at falling on the ball.
My theory has been that protecting the ball is a taught skill and some players, and therefore teams, are better than others. Consequently, some teams are more likely to fumble than others. However, fumble recoveries are random and depend on where players happen to be when the ball comes loose, who sees it first, and how an irregularly shaped ball bounces. Put simply, fumble recovery is chaotic and therefore not indicative of a team's future ability to produce or recover fumbles.
To test that theory, we can compare the correlations of fumbles stats, including fumble recovery ratios, to winning, points scored, and points allowed. If the fumble recovery ratio correlations are less than 0.15, they are not statistically significant (p=0.05) and this would be evidence that fumble recoveries are random.
The ratio is not significant for wins, points scored, or points allowed while overall fumbles and fumble rates are significant. This result indicates recoveries are indeed random. It also suggests that fumbles, and not fumbles lost is a better stat for estimating a team's future likelihood of fumbing.
Happy April Fools!
Save your money! Do not pay people for their stupid locks of the week!