
The NFL leader in expected points added for a running back? It's not rushing leader Adrian Petrson. It's not Marshawn Lynch, Doug Martin, Alfred Morris or Jamaal Charles -- the rest of the top five in rushing yards.
With 40.2 EPA -- a full 17 points clear of second-place Peterson -- Spiller holds the lead through Week 14. Despite only 144 carries -- 25th in the league, between Vick Ballard and Jonathan Dwyer -- he ranks 12th in rushing yards. His 944 on the season puts him between BenJarvus Green-Ellis and Shonn Greene, rushers with 94 and 86 more carries respectively.
Now, with Fred Jackson on injured reserve with a right knee injury, Spiller will be alone at the forefront of the Bills offense. Of course, Bills coach Chan Gailey qualified his statement:
"We'll play CJ as much as he can play," Gailey said. "Tashard [Choice] will rest him when he needs rest."
Last time Spiller was healthy and Jackson was out -- Week 10 against Miami -- Spiller received 22 carries, a career high, rushing for 91 yards and adding three receptions for 39 yards. At -0.2 EPA (-0.01 per play), it was his third-worst game of the season, but still better than the league running back average of -0.02 EPA per play.
Still, when a player puts up numbers like Spiller's over the past two seasons -- 6.0 yards per carry on 251 rushes -- one would figure his coaches have a reason for limiting his carries so heavily -- and a better one than just Fred Jackson's roster presence, capable as he may be.
But so far in his career, the only two times Spiller has gone over 16 carries -- the aforementioned Week 10 against Miami and 2011 Week 11 against the Jets (19 carries, 55 yards) -- he has had trouble. It's easy to get caught up in efficiency, but in many cases volume is valuable in and of itself.
So, the question: is there reason to believe running backs get worse with more carries? In sports, we often see a usage-efficiency tradeoff -- pitchers get worse the deeper they go in games, basketball players tend to shoot a worse percentage the more looks they take from the field, and, as detailed last week, quarterbacks get less efficient the more than have to throw the ball. Does the same apply to runners?
To answer the question, I pooled all games of at least five carries and fewer than two passes (to weed out running quarterbacks) from 2010 through this season, a total of 2349 games featuring rushers from Aaron Brown to Willis McGahee.
There actually appears to be a positive correlation -- more carries means more yards per carry -- but this is lkely due to survivor bias. That is the players who don't earn at least 10 carries don't get them, dragging the average down at the low end, and the players who get 30+ carries are typically destroying opposing defenses. Chopping off the extremes and looking at games with 10-30 carries gives us a nearly flat relationship:
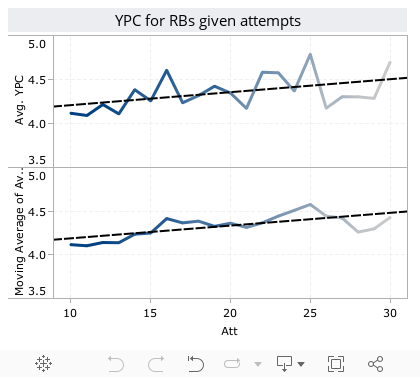
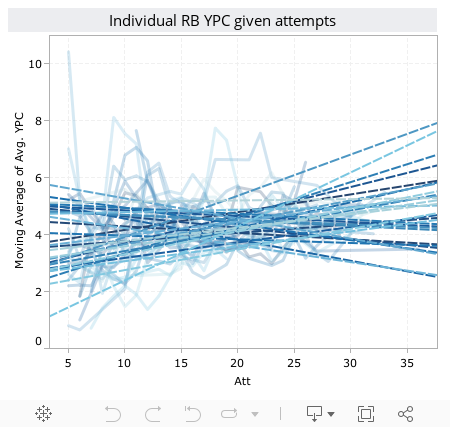
According to this relationship, an 20-carry increase is associated with a 0.3 YPC increase -- hardly anything that would turn a great running back into a replacement-level player or vice-versa. Bias is probably still at play at some level, though -- whether due to player skill or due to rushers getting more carries against bad defenses. Let's turn the focus to some individual players. In the sample, there are 29 players with at least 30 games of five rushes or more. Here they are shown individually:
Click here to see Spiller's (limited) profile and try yourself with other backs. A couple of runners have shown a moderate tendency to drop off -- about 12 extra carries relating to one fewer yard per carry: Pierre Thomas and Donald Brown. However, the correlations are weak (and don't hold up to a 95 percent significance test). As such, we can at least say there isn't statistical evidence here to suggest players get either better or worse as their carry load increases. To me, the intuitive result would have matched up with those of our other sporting examples, with some evidence of an efficiency dip as usage increased. However, I can think of reasons why we would instead see either no change or even a gain in efficiency as backs carry the ball more often: -- In the case of the basketball player taking more shots and the quarterback throwing more passes, a usage increase necessarily means a difficulty increase. The basketball players with the lowest usage rates are typically those only scoring off layups or putbacks; the quarterbacks with the lowest usage are usually powered by a great running game into easier passing downs. Adding more difficult mid-range jump shots or extra second-or-third-and-longs to the player's responsibility causes a drop in efficiency because the plays themselves are inefficient. -- The baseball pitcher, on the other hand, tires while his opponents generally remain fresh over the course of the game. The pitcher after five innings and 80 pitches is simply not of the same quality as he was facing the first few batters. The difficulty argument doesn't necessarily apply to running backs. Adding second or third and longs to a running back's responsibility may serve to increase his yards per carry, as teams will be willing to give up six yard gains on a second-and-10 or even 10-plus yard gains on 3rd downs behind the sticks. However, these runs could hurt the back's expected points and success rates -- a potential reason why Peterson lags so far behind Spiller despite his additional volume.
The physical limit argument may actually work in the rusher's favor. Although backs are taking a beating every time they plunge through the line, they dish one out as well, and the defenders battle in the trenches (as they say) on the passing plays as well. We hear all about the backs who improve as the game goes on -- their endurance can outlast the defense's.
Despite his impressive accomplishments throughout his first three seasons, C.J. Spiller has yet to show his stuff throughout a 20-30 carry game. Fred Jackson has limited his opportunities. But the Bills' coaches reluctance to run Spiller over and over again suggests a lack of confidence in his ability to handle the workload. Although the Bills coaching and training staff should know his body and capabilities far better than the observer at home (i.e., me) they can't truly find out what he can do with a larger load until they allow him to try. Spiller handled well over 20 touches per game his senior year with Clemson (he also returned punts and kicks) and rushed for a better average than in either his sophomore or junior years.
There's little statistical reason to believe a significant decline is in order either, and Spiller starts at such a lofty point where even the dropoffs exhibited by Pierre Thomas and Donald Brown with heavy carry loads would still leave Spiller well above average. It looks the Bills will finally free Spiller as this season closes, beginning this Sunday in Seattle. If Spiller can even come close to maintaining what he's done with limited loads so far, we could be in for some great performances over the next three games.


I'm a Vikings fan and have a hard time not going with AP as the league's best back. But I do like this analysis as I've been saying to people for some time that Spiller is a very very talented and underrated back. I mean, the guy might break Jim Brown's record!
The Bills sure have drafted a lot of good RBs the past few years (Spiller, Marshawn Lynch, Willis McGahee).
Great stuff as always. I was actually just wondering about this last weekend as the announcers were talking about how Peterson was one of those backs who "gets stronger as the game goes on" without any actual evidence. However, I'm not sure your analysis fully addresses that question. You are averaging the EPA for an entire game, correct? Would a truer test be to look at the EPA of each carry independently and see if it increases or decreases as the volume goes up (e.g. compare EPA of carry 1 to carry 20)?
I agree with Alan, it seems pretty obvious that the entire NFL would take Adrian Peterson over CJ Spiller.
It seems that EP is not representative of an RB's value, since the league average EP/P is below zero.
Well passes are included in a RB's EP which doesn't help take things into finer detail. It would be helpful if running EP and receiving EP for a RB'were separate collumns
"It seems that EP is not representative of an RB's value, since the league average EP/P is below zero."
Or, it means the league improperly uses and values its RBs.
Tell me, which great RB most recently led its team to a championship?
"It seems that EP is not representative of an RB's value, since the league average EP/P is below zero."
Or, it means the league improperly uses and values its RBs.
"Tell me, which great RB most recently led its team to a championship?"
--------------------------
um, all of them had a running back, and they were used on about half of all offensive plays.
keep in mind, we are not talking about "leading them to a SB", we are talking about "having a negative effect per play". that is what the negative EP/P means.
He said which *great* RB, not which running back. Here's a list of the past ten Super Bowl champions' starting RBs:
Ahmad Bradshaw
James Starks
Pierre Thomas/Reggie Bush
Willie Parker
Ahmad Bradshaw/Brandon Jacobs
Dominic Rhodes/Joseph Addai
Willie Parker/Jerome Bettis
Corey Dillon
Antowain Smith/Kevin Faulk
Michael Pittman
I think the only one you could even argue was great was Jerome Bettis. On the other hand, look at the QBs:
Eli Manning
Aaron Rodgers
Drew Brees
Ben Roethlisberger
Eli Manning
Peyton Manning
Ben Roethlisberger
Tom Brady
Tom Brady
Brad Johnson
A few all-time greats there, and whatever you think about Eli Manning, he's at least good.
OnSolThree, teams run the ball around 25 or 26 times a game.
Obviously, all these plays are not detrimental to the team.
Obviously, EP/P is not representative of the value of a RB, because it states that the NFL should eliminate the position. It simply does not capture all the important elements, it simply looks at down and field position (and time - please clarify this if I am incorrect).
And this notion of 'what RB lead a team to a SB' is ridiculous. What LB led his team to the SB. What Center? What DT? What cornerback? What safety? What OT? etc.
If the point is that a qb is more valuable than an RB, that is obvious. But that is not the point, the point is that RBs have a negative EP/P and thus "should" never touch the ball, which is nonsense.
adding one point, RBs have -0.2 EP/P and teams run about 25 times a game. that is -5 points per game. Quite a significant point spread, and if fact slightly greater than the average point spread in nfl games in the 2012 season.
Brian,
Couldn't a negative EP for RB overall be a result of the parameters from the model being estimated from historical data which may not accurately reflect the the "expected" part of the game today? Maybe defenses are better now, or running backs are not quite as good as they were?
Do you think it is a *possible* explanation for the negative EP?
RB's look more valuable/useful whatever word you want to use if you compare them to the average at their position in Win Probability added which is probably a more useful metric to compare them to QB's with. When coaches want to run a safe time killing play they are calling some plow up the middle that might have negative EP value on average but slightly above average WPA since it is killing clock.
Also its important to compare players on the site to their average or replacement level counterpart. Offense and more so passing has definitely shifted upward all around.
Also Adrian Peterson doesn't look as good on EPA/play here because his receiving value is dragging him way down. He's either a really bad receiver compared to SPiller or he is getting too many dumpoff passes when no one is open that have little to non chance of succeeding.
I'd say Terrell Davis, Marshall Faulk, and the three headead monster of Jacobs, Bradshaw Ward were pretty vital to their teams winning but they also had at least great QB's
The top end QB's are worth quite a bit more than the top RB's but it doesn't make the top RB's worthless either.
There are a couple other biases that exists between RB's.
1. If they don't play every down there is a bias if they are used in situations that lead to more EP on average.
2. I haven't done a full study but it certainly looks like RB's average more yards per carry on carries when their team is trailing vs when they are ahead. I'm not sure if this works out as far as WPA and EPA.
My final point. If you look at it from a win probability added over average player at that position per play, then RB's don't look basically pointless as they do from a raw EPA/P perspective. In fact Ray Rice and maybe Peterson if you just looked at his pure rushing looks more valuable than any of the top QB's with enough attempts using this method. If you use the replacement player method then But I agree with Brian that they RB's are overpaid and overvalued in general.
A great QB is just intrinsically more valuable because having a QB's skills seem more repeatable and transferrable to other teams. RB's just can't take so many poundings without it affecting their skills in a material way. Most RB's don't stay great for very long. It's also harder for them to do well behind a bad OL.
Also the offense tends to run through the QB.
>Obviously, EP/P is not representative of the value of a RB, because it states that the NFL should eliminate the position. It simply does not capture all the important elements, it simply looks at down and field position (and time - please clarify this if I am incorrect).
You are correct. However, WPA basically looks at "in-context" EPA. If you look at that this year, the highest rated running back so far is at 1.52 WPA, while the highest rated QB is at 4.48. Quarterbacks are simply more important.
>And this notion of 'what RB lead a team to a SB' is ridiculous.
Exactly. You need a competitive passing game to succeed. You do not necessarily need *any* other facet of the game as much.
The 16th best average QB this year is worth 1.7WPA while the 16th best RB is worth 0.26WPA.
Compared to the 16th best QB the top QB is relatively worth 4.48-1.7= +2.7WPA over 16th best
where the top RB is worth 1.52-0.26= 1.26 WPA over 16th best
The top QB is still worth more but the gap tightens
OnSolThree, and Anonymous
thanks for your comments, but they do not relate to this discussion. I simply pointed out that RBs, according to the EP/play, hurt their team. They result in negative pointed expected. Thus the conclusion would be to never run the ball (which is obviously ridiculous).
No one ever mentioned quarterbacks. I agree with both of you, quarterbacks are important.
Brian in the article you allude to RBs having more endurance and possibly being more effective late in the game as the defensive line wears down. I have long wondered if this bit of conventional wisdom holds true and would suggest it for a future study and article. Or if it exists if anyone could point me to it. Intuitively Ive always questioned why the defensive line gets more tired than the offensive line.
anon, re: RBs having more endurance. Good points by you and Brian.
Perhaps that is why the NFL has largely gone to a tandem RB strategy. I'd point out though that DLs do rotate frequently as well, but still you do see those huge guys wear down. It does seem that RBs would have an endurance advantage.
This post was by Jack, not Brian.
Wade-Interesting theory, but no. The overall negative average EPA and WPA values for RBs and runs in general have existed consistently through the years in the data set in addition to the current year.
"I simply pointed out that RBs, according to the EP/play, hurt their team. They result in negative pointed expected. Thus the conclusion would be to never run the ball (which is obviously ridiculous)."
since no one else has addressed this, i will try. in any given down and distance, a team has a baseline expected points scored. the e.p. of a play is zero when that number doesn't change. suppose, for instance, that if a team has a first and goal on the fifty, they will, on average, score 4.2 points. if they throw an incomplete pass, that will be negative e.p. if they gain 5 yards, that may or may not gain them e.p., depending on the situation (if there was 1 second on the clock, anything that isn't a score has negative ep). in each situation, there is a breakeven point where the expected points remain the same. running plays, on average, do not reach that threshold.
the fact that runs have negative ep does not in any way show that teams should never run. it simply shows that they should run less. if runs were less frequent, defenses would defend against them less, and therefore the e.p. would go up. at the same time, the value of passes would decrease. eventually, an equilibrium would be reached where the e.p of passing and running is equal...in fact, this equilibrium would be reached when the e.p. of passing and running both equal zero (neither would have an effect on how many points the team is expected to score).
as others have mentioned, there are also reasons to run EVEN if it is known to have negative e.p. (because WP is really what matters), but even if that weren't the case, negative e.p. on average for runs would not suggest that the rb position should be eliminated.
How many "great" backs in the past 30-40 years played on perennially good teams? Just thinking off top of my head a very short list. Most of the ones that come to mind were on bad teams
Here's the deal with AD's lower EPA. Because Ponder sucks, the Vikings run in situations where for the average team, the optimal option is to mostly pass. Therefore AP's 2nd and 12 runs are being compared to most teams 2nd and 12 passes and as good as Peterson is, he isn't as good as a competent passing game in a lot of the situations he's being used in. Ergo we see a -EPA.