
Here they are from last season, and here they are for 2013.
Not spectacular. It's a team sport, and these are team numbers. But Richardson's stats don't show any indication he's a game changer. He was 72nd in the league with -19.7 EPA and 58th with -0.03 EPA/P. When you watch him, he's hard to bring down, and occasionally gets a yard or two more than a typical RB. But when a team spends a first round pick on a RB, it should expect more than just a couple of extra yards per game than typical.
Last season IND was 7th in run EPA/P and 9th in run SR, so this trade could be a fun experiment in isolating the value of a RB from the rest of the offense. We'll see.
Showing posts with label running backs. Show all posts
Showing posts with label running backs. Show all posts
Trent Richardson's Game by Game Advanced Stats
published on 9/18/2013
with
14
comments

Don't Pay CJ!

Adrian Peterson is currently the highest paid RB who is due to make $11 million this season, which is probably two to three times too much. RBs, and the running game in general, do not have the impact on wins and losses the same way the passing game does. But more importantly, the spread between the best and the mediocre RBs is much smaller than the the spread among quarterbacks.
We can't quantify the value of a player the way the MLB analysts can, with Wins Above Replacement and other stats. But we can at least make some back-of-the-envelope, order-of-magnitude estimates.
published on 8/22/2011
with
57
comments
Is Adrian Peterson a Liability?
 Tiki Barber recently called Adrian Peterson "a liability for his team" due to his propensity to fumble. Is that assessment fair? What if Peterson's fumbles really did hurt his team more than his overall performance helps? Peterson himself admits he has a fumble problem, and he's promised to work on it in the off-season. How many fumbles is too many when it comes to a break-away home-run hitter like Peterson?
I'll look at Peterson's fumbles in three contexts. First, I'll look at his rumble rate, which accounts for how often he's asked to carry the ball. Second, I'll look at how costly his fumbles have been in terms of Win Probability Added (WPA). And third, I'll look at his fumbles in terms of Expected Points Added (EPA), which is less sensitive to game situation as WPA.
Aside from his recent fumble problems in the NFC Championship Game, Peterson has committed 4, 9, and 7 regular season fumbles over his three-year career. That's certainly more fumbles than you'd like to see, but keep in mind how often he's asked to carry the ball.
Any fumble is equally likely as any other to result in a turnover or recovery, so I'll start by looking at fumbles rather than fumbles lost. Further, fumble rate is going to tell us more than total fumbles about a player's proclivity to lose the ball. For RBs, especially guys who get a lot of receptions, it makes sense to consider their total touches, which includes carries and receptions.
published on 2/03/2010
with
22
comments
The 2009 All-WPA Team
 The day after the Pro Bowl rosters are announced there are the obligatory "snub" articles in local papers around the country. In the DC area, the annual London Fletcher snub article is simply reprinted from last year's Post. So what about those Vincent Jacksons and Cedric Bensons who were unfairly left off the roster in favor of big name stars who may not have had a particularly good year? Who really earned their ticket to Miami?
I'll compare players using two different stats. Win Probability Added (WPA) measures each play's increase or decrease in a team's chances of winning. For every play that a player is mentioned in the play-by-play description, including penalties, turnovers and everything else, the WPA is tallied in his name. WPA is a narrative stat. It tells the story of what happened and is very context-dependent. It measures performance when it matters most. It has limited applications in terms of predicting future player performance, but it my mind it's perfect for comparing Pro Bowl and MVP contenders--even Hall of Fame candidates once there's enough data.
published on 12/31/2009
with
16
comments
Comparing Running Performance
 This post follows a discussion of how to rate running back performance (or team rushing performance) that began at PFR and continued at Smart Football. I'll add my two cents here.
Yards per carry (YPC) is a useful stat, but it doesn't tell us everything we want to know. Median yards gained isn't very useful because, with rare exceptions, every RB will have a median gain of 3 yds. There are any number of suggestions for alternate measures such as yards above team median, yards above replacement, or success rate (the Hidden Game of Football system used by Football Outsiders). The comments at the Smart Football post feature a great discussion of the topic. Unfortunately, there really is no single number that can capture the full picture. In fact, what we really need is a picture.
I'll explain that in a minute, but first I want to address an age-old water cooler question that Chris discussed in his post at Smart Football. Consider two RBs, both with identical YPC averages. One however, is a boom and bust guy like Barry Sanders, and the other is a steady plodder like Jerome Bettis. Which kind of RB would you rather have on your team?
The answer is it depends. Essentially, we have a choice between a high-variance RB and a low-variance RB. When a team is an underdog, it wants high-variance intermediate outcomes to maximize its chances of winning. And when a team is a favorite, it wants low-variance outcomes. Whether those outcomes occur through play selection, through 4th down doctrine, or through RB style isn't important. If you're an otherwise below-average team, you'd want the boom and bust style RB. If you're an otherwise above-average team, you'd want the steady plodder.
The same concept applies within a game. If you're losing during a game, you have become the underdog no matter how strong your team seemed on paper before kickoff. In this case, you want to increase the risk-reward balance with high-variance plays. You'd accept the risk of a 10-yd loss in the backfield for the possibility of breaking a 40-yd run. But if your team is up by a TD, the 10-yd loss isn't so acceptable.
Further, even if the high-variance RB has a lower average YPC, we'd still might want him carrying the ball when we're losing. This is due to the math involved in competing probability distributions.
Now back to the question on how to evaluate a RB or team rushing game. Mean, median, or even mode are handy ways of describing a central tendency. But on their own, they don't paint the whole picture. It's a bit like the proverb about several blind men each grasping a part of an elephant. We could say that LaDainian Tomlinson's 4.4 career YPC figure is good because it's above average, but it doesn't tell us much more than that. It's like grasping the elephant's trunk. Instead, we can look at the whole elephant.
Below is the distribution of Tomlinson's career gains. The horizontal axis are the gains, and the vertical axis represents how often he got each gain. The blue line is distribution for the NFL as a whole, and the red line is Tomlison's distribution.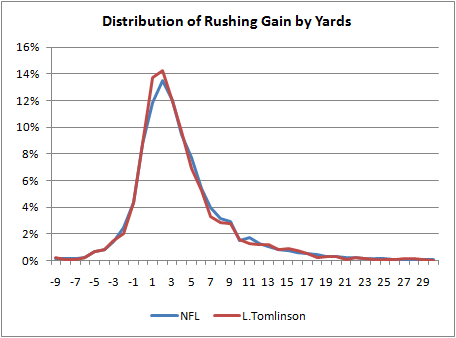
We could simplify the distribution into large bins selected for certain signifcance. For example, we could divide the distribution into all losses, gains of 1-4 yds, 5-10 yds, and 10 yds or more. Tomlinson might be a "10/45/35/10." This is unwieldy, but it's not much different than how the baseball guys use a similar shorthand for wOBA, BAPIP, and the other stats they often bundle together.
Not that I'd ever expect anyone to use this, but we could use a more technical shorthand. The RB gain distributions can be modeled as a gamma distribution, a bell-type curve described by 2 parameters--k and theta. For example, Tomlinson is a Gamma(11, 1.1). That's about all we'd need to know to reproduce his gain distribution. The parameters are not intuitive at all, so it's not a workable solution. (Perhaps someone out there might suggest a better type of distribution to use.)
To be honest, I was expecting a bigger difference between Tomlinson and the rest of the league. So I looked at some other RB's distributions. I wanted to see a difference between boom-and-bust guys and plodder-types. I picked Adrian Peterson and Brian Westbrook to compare to Jerome Bettis and Jamal Lewis. Their distributions are plotted below.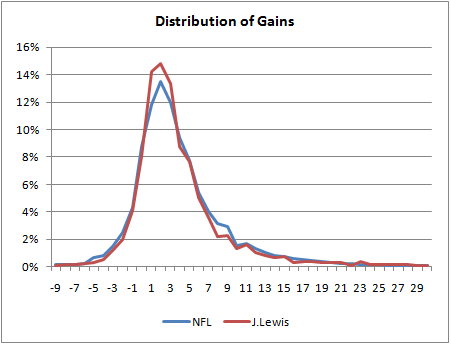
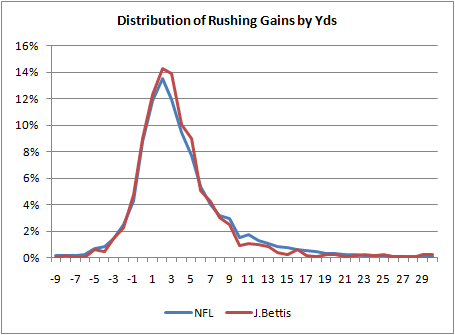
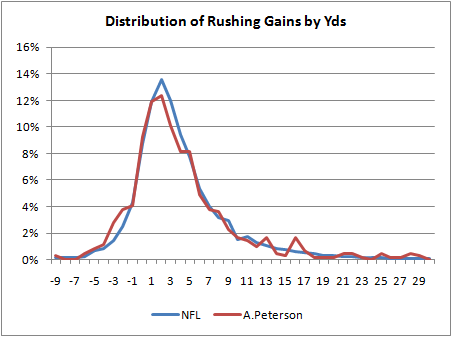

What amazes me is how similar they all are to each other and to the league average. One notable exception is Jamal Lewis' peak. He has significantly more runs of between 0 and 3 yards than other backs. If you read the plot the wrong way, this might appear good, but it's defninitely not. Usually, a RB needs 4 to 5 yards to just break even in terms of his team's probability of converting a first down. What we'd want to see on a RB's distribution is as much probability mass as possible to the right of 4 yards.
So if Bettis' distribution looks so much like Tomlinson's, how does Bettis have a 3.9 career YPC and Tomlinson have a 4.4 career YPC? As others have noted previously, the difference among RB YPC numbers primarily come from big runs. It's the open field breakaway ability that separates the guys with big YPC stats from the other RBs. Of Tomlinson's runs, 1.5% were for 30 yards or more. Bettis' 30+ yd gains comprised only 0.46% of his carries. The other RBs and the league average are as follows:
NFL 0.91%
Lewis 0.88%
Westbrook 0.93%
Peterson 2.20%
Adrian Peterson's 2.2% figure is exceptional. It's interesting because it really suggests that what separates Peterson as a great runner is based on only 2% or so of his runs. Otherwise, he's practically average.
Of course, the usual caveats apply. When talking about a specific RB, we are really talking about his team's running performance when the RB has the ball. And we haven't considered game situation yet. Ideally, we'd want to plot a series of distributions, one for each typical down and distance situation--1st and 10, 2nd and long, 2nd and mid/short, and 3rd and short. But that's a far cry from a nice handy single number.
published on 8/13/2009
with
27
comments
Michael Turner in 2009
 One of the more popular articles here over the past year or so has been the 'Myth of 370' article that debunked the direct connection between very high carries one season and significant decline the following season. Atlanta running back Michael Turner is at the center of the discussion this year, at least in terms of fantasy production. He had 376 carries in a breakout season, so naturally fans are wondering what to expect from him in 2009.
Judging by some of the discussion out there, I'm worried some people misunderstand what the Myth of 370 article says. What it does not say is that Michael Turner can be counted on this year to match his 17 TDs and 106 yds per game from 2008. In fact, history suggests he won't repeat. What the article does say is that a RB's tendency to decline after a career year is not due to overuse the previous year.
For a RB to have a career year, a lot of things come together all at once. By definition, he's healthy himself. Plus, he's usually at his peak athletically, he has a talented and healthy offensive line, and his opponents tend to be weak at defending the run. Should we expect the stars to align the same way in following year?
Of course not. Linemen come and go or get hurt, opponents change, and lots of other factors change. Chances are most of those factors aren't going to get better, but get worse. This natural process is at the heart of the concept of regression to the mean. To see what I mean, look at the two following graphs based on top RB performances from 2001 through 2008.
The first graph plots RB rushing TDs per game from one year vs. his rushing TDs per game from the following year. A regression line is fit to the data, showing us what we can typically expect from one year to the next. For example, Michael Turner's 1.1 TDs/G from 2008 would typically suggest a 0.8 TD/G output in 2009.
The same effect is present in rushing yards. Turner's 106 Yds/G from 2008 can be expected to tend towards about 85 Yds/G in 2009.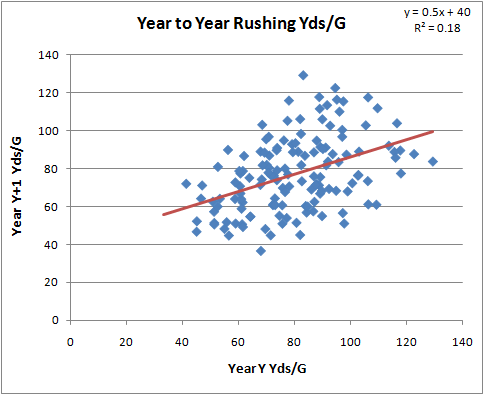
These graphs are presented in terms of 'per game.' Total production is therefore heavily dependent on how many games a player appears in. The top RBs from one year (regardless of the number of carries) tend to play in only 13 out of 16 games the following year. This should also temper anyone's enthusiasm for a repeat year from Michael Turner.
However...these regression effects apply to all RBs, not just Turner. So you shouldn't avoid Turner any more or less than any other top RB in your fantasy draft. Plus, the regression only explains a fraction of the following year's performance. Turner could score 30 TDs or he could score zero. It's all a crap shoot, and I'm only discussing tendencies.
More on regression to the mean and: wide receivers / coaches / turnovers.
published on 7/20/2009
with
3
comments
Drafting RBs
 Can solid running backs really be found anywhere in the NFL draft? Years ago the conventional wisdom seemed to be that a team needed a superstar RB from the first round to win consistently. Now it seems that the conventional wisdom is that teams still need a star ball carrier, but one can be found deep in the draft. So which is it?
Data
The data consists of RB draft picks from the 1980 through 2000 drafts found at Pro-Football-Reference.com. Running back career performance was judged three ways. First, I averaged the likelihood a RB would be selected to one or more Pro Bowls by round and draft order. Second, I averaged career Yards Per Carry (YPC) by draft round and by draft order. (I also tried various ways of including receiving yards, but the variance in Yards Per Reception is very large and it distorted the data, particularly for players with relatively few receptions. Ultimately, simple YPC worked best and aligned closest with how most people see RBs. That is, Steve Sowell and Dave Meggit aren't ranked above Barry Sanders, Thurmond Thomas, or Emmit Smith.) And lastly, I averaged the number of years as the primary starter by round and by draft order.
Pro Bowl Selection
Although Pro Bowl selection is a flawed measure of career performance in many ways, it can indicate that a draft pick has "panned-out." If you sort the data by PB selection, it very quickly separates the generally productive RBs from the "three yards and a cloud of dust" guys. After looking at PBs for a number of positions now, it seems that 2 or more PB selections is a particularly good measure of career productivity, especially when judging top draft choices.
The graphs below illustrate the likelihood that a RB will be selected to one or more, two or more, and three or more PBs. The first graph is by draft round, and the second graph is by RB draft order (i.e. 1st RB taken, 2nd RB taken, etc.)

I wouldn't read too much into the spike at the 5th RB taken. It's likely just a statistical quirk, but it might be one reason why many experts believe that later round RBs are as good as early round picks.
[Edit: Some have asked why I brushed off the spike of Pro Bowls at the 5th RB taken as a quirk. If we analyze enough draft picks for various positions, as I'm in the process of doing, we're bound to see a significant bunching like this by chance once or twice. The graph is relatively continuous except in one place, where there is a depressed result at the 4th and 6th pick and the spike at the 5th. What is likely at work is that positive results in the 5th pick "bin" have randomly "stolen" positive results from the 4th and 6th bin. There were 20 RBs taken as the 5th RB in the data set, so it would only take 2 or 3 RBs who would otherwise have been the 4th or 6th pick to be bunched into the 5th pick to give us this result. Unless we had a reason to believe there is some special quality about the 5th RB taken before seeing the results, we should not interpret the data to say there is something magical about being the 5th RB taken.]
Yards Per Carry There is probably no simpler and truer measure of running back performance than yards per carry. Of course, YPC does not belong to the RB alone. For any one RB's season, offensive line ability has a tremendous influence on his stats. But over 490 careers and over 24 years of data, the abilities of offensive lines will average itself out to a great degree, leaving career YPC a reliable estimate of true RB performance when grouped by round or draft order.
As with QBs, the biggest question is how to score draft picks with no carries or very few carries. RBs with fewer than 200 career carries tended to have extreme YPC stats. I assigned them the YPC of the 5th percentile qualifying RB, which was 3.58.
The two graphs below break out career YPC by draft round and by draft order.
 The first round RBs, particularly the first couple taken, tend to significantly outperform later picks. By the 3rd or 4th round and the 7th RB taken, teams are likely getting sub-replacement level special teams fodder.
Also notice the nearly 1:1 relationship between career YPC and PB selections, including the spike at the 5th RB taken. This suggests that PB selection is merit-based and is a reasonable proxy for grading career performance.
Scouting Accuracy
How often do the scouts get it right? In other words, how often does the higher pick turn out to be better than the next pick? The two table below lists the likelihood that the higher pick will have a better career YPC than the next RB taken in the same draft. We shouldn't expect the scouts to be perfect, but this table tells us how difficult it is to predict the better player.
| RB Pick | Pr(Better) |
| 1 | 0.62 |
| 2 | 0.67 |
| 3 | 0.57 |
| 4 | 0.48 |
| 5 | 0.55 |
| 6 | 0.33 |
| 7 | 0.43 |
| 8 | 0.33 |
| 9 | 0.33 |
| 10 | 0.38 |
Years as Primary Starter
Another way of judging the value of draft picks is the number of years the pick has served has his team's primary starter. Top RB picks, especially the first two each year, tend to serve much longer as a primary starter.
| Round | Yrs as Primary Starter |
| 1 | 4.1 |
| 2 | 2.7 |
| 3 | 1.5 |
| 4 | 0.7 |
| 5 | 0.8 |
| 6 | 0.6 |
| 7 | 0.5 |
| RB Pick | Yrs as Primary Starter |
| 1 | 5.0 |
| 2 | 5.1 |
| 3 | 3.2 |
| 4 | 2.4 |
| 5 | 3.7 |
| 6 | 1.6 |
| 7 | 1.9 |
| 8 | 1.4 |
| 9 | 2.7 |
| 10 | 1.0 |
| 11-22 | 0.8 |
Conclusion
 Top picks solidly outperform subsequent picks. The top two RBs taken tend to almost be in a class to themselves, then there is a steady decline in expected performance until the 8th RB taken, at which point there is very little to be expected from a pick.
So do teams need a superstar #1 pick RB to win, or can they find a premier runner deep in the draft? Which conventional wisdom was right? My theory is it's neither.
I think most people still grade RBs in terms of total yards, whether it's for a single game or for a season. Even though it should be well known now that winning leads to running, rather than vice versa, commentators and analysts continue to count 100 yard games or 1000 yard seasons as measures of RB effectiveness.
But even below-average RBs on winning teams with good passing games and good defenses will tend to accumulate large chunks of total yards due to frequent carries. Even a RB who was a 5th round pick on a great passing team will appear much better than he truly is. I believe that might explain the perception that solid RBs can be found anywhere in the draft.
The better RBs really do come from the top picks. It's just that they're not that important, or at least they're not as important as they were in the 1970s before the NFL became a passing league. Plus, our understanding of which RBs are truly the very good ones is distorted by analysts who insist on total yards as the best measure of RB performance.
published on 4/20/2008
with
7
comments
RB Wins Added 2006
Similar to my efforts to devise a better QB rating, I've applied the same method to estimating the wins contributed by running backs. Although not perfect, it provides a sense of who is helping his team and who is hurting his team, and by how much.
The components of the RB rating are weighted according to how important they are in terms of team wins. The formula is based on a multivariate regression model of team wins. Using data from the past five NFL regular seasons, the regression model estimates team wins based on the efficiency stats of each team including passing, running, turnovers, and penalties.
The rating includes Yards Per Carry (YPC), fumble rate, and an adjusted Yards After Catch per reception (YAC/Att). YAC/Rec is adjusted to reflect the fact that RB receptions constitute 14% of all team pass attempts. Fumble rate is defined as fumbles per carry plus receptions.
Some may ask why I don't include touchdowns in the rating. Touchdowns are the result of yards per carry, reception yds, etc. Including TDs would also skew the rating towards the Alstott-esque "vulture-backs." Also, rushing TDs are often the result of an excellent passing game that frequently gets the ball close to the goal line, and not necessarily the result of good rushing.
The RB rating is computed in terms of how many wins a RB contributes to his team through his level of performance over the course of a full 16-game season, all other things being equal. The equation is:
+WP16 = [(YPC * 0.92) + (YAC/Att * 1.57) - (Fum Rate * 63.2)] - 4.0
(I subtract 4.0 as the linear constant because it's the average score for RBs. An average RB on an average team would produce exactly 8 wins, not 12.)
The resulting ranking of 2006 RBs is below. Keep in mind the list assumes a full 16-game season for each RB.
| Player | Team | Rush | YPC | YAC/Att | Fum | +WP16 |
| Norwood | ATL | 99 | 6.4 | 0.5 | 0 | 2.6 |
| Jones-Drew | JAC | 166 | 5.7 | 0.6 | 1 | 1.8 |
| Tomlinson | SDG | 348 | 5.2 | 0.6 | 2 | 1.3 |
| Jones | DAL | 267 | 4.1 | 1.0 | 1 | 1.1 |
| Barber III | DAL | 135 | 4.8 | 0.4 | 0 | 1.1 |
| Westbrook | PHI | 240 | 5.1 | 0.5 | 2 | 1.0 |
| Barber | NYG | 327 | 5.1 | 0.5 | 3 | 1.0 |
| Taylor | JAC | 231 | 5 | 0.7 | 3 | 0.9 |
| Portis | WAS | 127 | 4.1 | 0.7 | 0 | 0.8 |
| Johnson | KAN | 416 | 4.3 | 0.7 | 2 | 0.7 |
| Gore | SFO | 312 | 5.4 | 0.5 | 6 | 0.6 |
| Addai | IND | 226 | 4.8 | 0.5 | 2 | 0.6 |
| Benson | CHI | 157 | 4.1 | 0.6 | 0 | 0.6 |
| Maroney | NWE | 175 | 4.3 | 0.6 | 1 | 0.6 |
| Bell | DEN | 157 | 4.3 | 0.6 | 1 | 0.5 |
| Jacobs | NYG | 96 | 4.4 | 0.9 | 2 | 0.3 |
| Williams | CAR | 121 | 4.1 | 0.6 | 1 | 0.3 |
| Dillon | NWE | 199 | 4.1 | 0.7 | 2 | 0.3 |
| Jackson | STL | 346 | 4.4 | 0.5 | 4 | 0.3 |
| Jones | CHI | 296 | 4.1 | 0.4 | 1 | 0.2 |
| Washington | NYJ | 151 | 4.3 | 0.6 | 2 | 0.2 |
| Dunn | ATL | 286 | 4 | 0.5 | 1 | 0.2 |
| Henry | TEN | 270 | 4.5 | 0.4 | 3 | 0.0 |
| Dayne | HOU | 151 | 4.1 | 0.4 | 1 | 0.0 |
| Jordan | OAK | 114 | 3.8 | 0.6 | 1 | -0.1 |
| McAllister | NOR | 244 | 4.3 | 0.4 | 3 | -0.1 |
| Lundy | HOU | 124 | 3.8 | 0.5 | 1 | -0.1 |
| Betts | WAS | 245 | 4.7 | 0.5 | 6 | -0.1 |
| Houston | NYJ | 113 | 3.3 | 0.5 | 0 | -0.3 |
| Morency | GNB | 96 | 4.5 | 0.5 | 2 | -0.3 |
| Green | GNB | 266 | 4 | 0.6 | 4 | -0.3 |
| Fargas | OAK | 178 | 3.7 | 0.4 | 1 | -0.3 |
| Brown | MIA | 241 | 4.2 | 0.5 | 4 | -0.3 |
| McGahee | BUF | 259 | 3.8 | 0.7 | 4 | -0.3 |
| Parker | PIT | 337 | 4.4 | 0.5 | 7 | -0.4 |
| Bush | NOR | 155 | 3.6 | 0.5 | 2 | -0.5 |
| Morris | SEA | 161 | 3.8 | 0.3 | 1 | -0.5 |
| Taylor | MIN | 303 | 4 | 0.4 | 5 | -0.6 |
| Bell | DEN | 233 | 4.4 | 0.4 | 5 | -0.6 |
| Thomas | BUF | 107 | 3.5 | 0.4 | 1 | -0.7 |
| Lewis | BAL | 314 | 3.6 | 0.5 | 4 | -0.8 |
| Foster | CAR | 227 | 4 | 0.3 | 4 | -0.8 |
| Williams | TAM | 225 | 3.5 | 0.4 | 3 | -0.9 |
| Jones | DET | 181 | 3.8 | 0.6 | 5 | -0.9 |
| James | ARI | 337 | 3.4 | 0.3 | 3 | -0.9 |
| Rhodes | IND | 187 | 3.4 | 0.4 | 3 | -1.1 |
| Johnson | CIN | 341 | 3.8 | 0.3 | 6 | -1.1 |
| Droughns | CLE | 220 | 3.4 | 0.5 | 5 | -1.4 |
| Barlow | NYJ | 131 | 2.8 | 0.3 | 1 | -1.5 |
| Alexander | SEA | 252 | 3.6 | 0.3 | 6 | -1.7 |
published on 9/25/2007
with
7
comments
Median Rushing Yards
What's the difference between these two situations?
1. On 1st and 10 from the opponent's 30, a RB gets a handoff and breaks free for a 30 yd TD.
2. On 1st and 10 from his own 30, a RB gets a handoff and breaks free for a 70 yd TD.
In both plays, the RB read the blocks and made the moves necessary to break into the open field. In both plays the RB's speed and agility beat the safeties. But the difference of 50 yds is basically statistical trash because in situation #1, the RB likely could have kept running for another 50 yds.
In rating running ability, I've previously suggested the use of median statistics rather than average statistics. When we want to know how good a team's running game is, or how good a RB is, we want to know the central tendency of the team or player. The statistical mean is only one way of looking at central tendency. Median can often be more useful. Averages are often distorted by a very few outlier inputs.
Consider this fictitious example examining the central tendency of college dropouts who live in Redmond, WA. Let's say there are 5,000 college dropouts in Redmond, Washington, and each make $30,000/yr except this one guy named Gates. He makes $20 billion/yr. The average salary of a college dropout in Redmond is over $4 million/yr. So if I'm a student in Redmond I should skip class tomorrow, right? $4 million/yr might be the average, but it's not the central tendency and it's virtually useless information.
Which player would you rather have on your team? A RB who gets at least 4 yds on every carry, or a RB who gets 29 1-yd runs and one 91-yd run? Both players average 4 yds/carry. The first player's median rush is 4 yds and the second player's is 1 yd. It's an extreme example, but it illustrates my point. Consistency has its value.
Here are a list of the top runners of 2006 sorted in order of their percentage of runs >4 yds. It's interesting to compare to their average yds/rush, their total yards, and other stats. (Ties are broken by % of carries > 3 yds.)
| RB | TEAM | 4YD PCT | ATT | YDS | AVG | TD | FUM | LST | TD/ATT% |
| Norwood | ATL | 57 | 99 | 633 | 6.4 | 2 | 0 | 0 | 2.0 |
| Addai | IND | 54 | 226 | 1081 | 4.8 | 7 | 2 | 2 | 3.1 |
| Westbrook | PHI | 50 | 240 | 1217 | 5.1 | 7 | 1 | 1 | 2.9 |
| Washington | NYJ | 50 | 151 | 650 | 4.3 | 4 | 1 | 1 | 2.6 |
| Betts | WAS | 48 | 245 | 1154 | 4.7 | 4 | 4 | 2 | 1.6 |
| Barber | NYG | 47 | 327 | 1662 | 5.1 | 5 | 3 | 1 | 1.5 |
| Barber | DAL | 47 | 135 | 654 | 4.8 | 14 | 0 | 0 | 10.4 |
| Tomlinson | SD | 46 | 348 | 1815 | 5.2 | 28 | 2 | 1 | 8.0 |
| Gore | SF | 46 | 312 | 1695 | 5.4 | 8 | 5 | 5 | 2.6 |
| Jones | CHI | 46 | 296 | 1210 | 4.1 | 6 | 1 | 1 | 2.0 |
| McAllister | NO | 46 | 244 | 1057 | 4.3 | 10 | 2 | 1 | 4.1 |
| Vick | ATL | 46 | 123 | 1039 | 8.4 | 2 | 4 | 2 | 1.6 |
| Jones-Drew | JAX | 46 | 166 | 941 | 5.7 | 13 | 1 | 1 | 7.8 |
| Dillon | NE | 46 | 199 | 812 | 4.1 | 13 | 2 | 2 | 6.5 |
| Jackson | STL | 45 | 346 | 1528 | 4.4 | 13 | 2 | 1 | 3.8 |
| Dayne | HOU | 45 | 151 | 612 | 4.1 | 5 | 1 | 0 | 3.3 |
| Brown | MIA | 44 | 241 | 1008 | 4.2 | 5 | 4 | 2 | 2.1 |
| McGahee | BUF | 44 | 259 | 990 | 3.8 | 6 | 4 | 2 | 2.3 |
| Fargas | OAK | 44 | 178 | 659 | 3.7 | 1 | 1 | 0 | 0.6 |
| Benson | CHI | 44 | 157 | 647 | 4.1 | 6 | 0 | 0 | 3.8 |
| Henry | TEN | 43 | 270 | 1211 | 4.5 | 7 | 3 | 1 | 2.6 |
| Williams | TAM | 43 | 225 | 798 | 3.5 | 1 | 2 | 2 | 0.4 |
| James | ARI | 42 | 337 | 1159 | 3.4 | 6 | 3 | 3 | 1.8 |
| Foster | CAR | 42 | 227 | 897 | 4.0 | 3 | 3 | 2 | 1.3 |
| Maroney | NE | 42 | 175 | 745 | 4.3 | 6 | 1 | 1 | 3.4 |
| Rhodes | IND | 42 | 187 | 641 | 3.4 | 5 | 2 | 2 | 2.7 |
| Taylor | MIN | 41 | 303 | 1216 | 4.0 | 6 | 4 | 3 | 2.0 |
| Taylor | JAX | 41 | 231 | 1146 | 5.0 | 5 | 2 | 1 | 2.2 |
| Bell T. | DEN | 41 | 233 | 1025 | 4.4 | 2 | 3 | 3 | 0.9 |
| Bell M. | DEN | 41 | 157 | 677 | 4.3 | 8 | 1 | 0 | 5.1 |
| Johnson | KAN | 40 | 416 | 1789 | 4.3 | 17 | 2 | 2 | 4.1 |
| Johnson | CIN | 40 | 341 | 1309 | 3.8 | 12 | 6 | 2 | 3.5 |
| Lewis | BAL | 40 | 314 | 1132 | 3.6 | 9 | 4 | 2 | 2.9 |
| Jones | DAL | 40 | 267 | 1084 | 4.1 | 4 | 1 | 1 | 1.5 |
| Droughns | CLE | 40 | 220 | 758 | 3.4 | 4 | 5 | 4 | 1.8 |
| Parker | PIT | 39 | 337 | 1494 | 4.4 | 13 | 6 | 4 | 3.9 |
| Dunn | ATL | 39 | 286 | 1140 | 4.0 | 4 | 1 | 0 | 1.4 |
| Alexander | SEA | 39 | 252 | 896 | 3.6 | 7 | 5 | 3 | 2.8 |
| Morris | SEA | 39 | 161 | 604 | 3.8 | 0 | 1 | 1 | 0.0 |
| Green | GB | 37 | 266 | 1059 | 4.0 | 5 | 2 | 2 | 1.9 |
| Jones | DET | 36 | 181 | 689 | 3.8 | 6 | 4 | 4 | 3.3 |
I'm not suggesting average rushing is worthless, just that it is only part of the story.
published on 8/08/2007
with
0
comments
Subscribe to:
Posts (Atom)