- Home All posts
How Much Money is a Sack Worth?
Offenses get all the attention, so I thought I'd toy around with what I have so far on defense. Sacks are one of the most visible and tangible defensive statistics. I took the primary sack makers, defined as DTs, DEs or LBs who have averaged over one sack per season in their career, and plotted their career average sack rate against their average cap hit.
A few notes about the data: Only those years with cap hits greater than $1M were included as a crude way to focus on every-down starters. Additionally, only seasons where the player had 7 or more game appearances were included. The data ranges back as far as 2006 for whoever I had salary data for. Cap hit was adjusted for salary cap inflation--All cap hits are in $2012 cap dollars. Lastly, 'sacks per season' is extrapolated for each player to full 16-game seasons.
Cade Massey on Flipping Coins and the NFL Draft
Massey has continued research into the draft. His presentation at the 2012 MIT Sloan Sports Analytics Conference outlines his recent findings. (I recommend using IE to view the presentation. Chrome didn't play nice with the video.) The slides from the brief can be viewed here.
If I understand things correctly, Massey has found that:
EPA Production and Cap Value, Skill Positions
As a measure of production I used Expected Points Added (EPA)--actually EPA per game to account for injury shortened seasons. For the measure of player value, I used cap hit. Cap value is useful because it boils down the complexity of many NFL contracts into one number. It can be tricky, though, as many contracts can be quite uneven from year to year in terms of cap value. For cap management and player-incentive purposes a 4-yr/$40M will often diverge far from a steady $10M per year cap hit. To account for this, I averaged each players' per year cap hit for the full period ('06-'12) and plotted against each player's EPA/G. The purpose of doing this is to see what level of production teams expect per $1M of salary. Is there a solid connection between true production and salary?
There are assumptions and limitations inherent in this analysis. Player production is dependent on the abilities of their teammates. WRs and TEs rely on their QBs to get them the ball, and some will have better passers and some will have worse, and vice versa. RBs are dependent on their line and scheme. But over the league as a whole, these considerations would (ideally) balance out. Put simply, for every Larry Fitzgerald being victimized by the offense around him, there's a Brandon Lloyd benefitting from being on a great offense.
The chart below plots offense skill position production by annual average cap hit. Each position is color coded.
Sloan Sports Analytics Conference Video
The format kept the event from becoming a dry drone fest. We took several interesting in-game decisions and analyzed them from our own perspectives. Also, Herm was wearing really colorful socks. If you want to know why there is a picture of an air conditioner in this post, you'll have to watch the panel.
As a bonus, here is the link to the other football panel at this year's conference, featuring FO's Aaron Schatz, Paraag Marathe (SF), Kevin Demoff (STL), and Scott Pioli (formerly KC). The videos of the other conference panels can be found here.
Thanks to Ben Levitt, Monte McNair, Daryl Morey, and the other organizers who made the event so much fun.
SITE NEWS
Many readers have probably wondered why I haven't been posting articles nearly as often as I had in years past. Here's the reason--The one-year news embargo is officially lifted, and I can officially announce my participation in a project so big and so cool I can hardly describe it with words. I'll let the page at IMDb say it all. Thanks to everyone for all their support throughout this process. It wouldn't have been possible without the loyal fans of ANS!
Win Probability Forfeited 2012
by Matt Meiselman
Matt has been helping me crunch some 4th down numbers this off-season. He is a senior at the University of Maryland studying broadcast journalism. He's originally from New Jersey, but loves New York sports. Matt aspires to work in sports media and has a passion for sports statistics. -BB
In last year's article on this subject, Brian talked about how coaches aren’t just saving wins if they’re more aggressive; they are simultaneously forfeiting wins by being too meek. In 2011, the average team forfeited .65 wins for the year on 4th down decisions alone. The NFL has started to become more risk-friendly instead of risk-averse, and you’d expect that with more innovative minds in the game, like Bill Belicheck and Jim Harbaugh, the league would be trending towards more optimum game management. This was not the case in 2012.
During the 2012 season, the average team forfeited .73 wins, a significant increase from the year before. The average win probability forfeited per opportunity also rose, jumping from 1.6% of a win to 1.9% of a win. Below are the calculations for each team:
Team Analytics Interns
An NFL team is looking for football research interns for the summer. There is a chance that the position could become full time after the summer if the candidate is outstanding.
All interested candidates should send a resume and cover letter to nflanalyticsintern@gmail.com. In the cover letter, please detail any relevant analytics experience and describe one question you would like to study if you had access to an NFL team’s data. Special preference will be given to those with database and/or programming skills.
Tell 'em ANS sent you.
What is Ed Reed's Going Value?
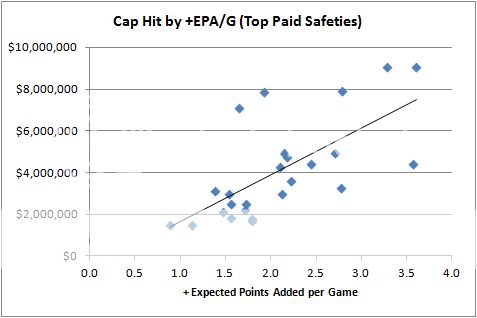
Here, price is defined by salary cap hit. NFL salaries are notoriously complex with bonuses and guarantees. But these are boiled down into a single cap number, which is the cost to his team's overall salary cap, the most precious resource it has in acquiring and keeping players.
The analysis here produced the chart below. In short, top FA safeties are valued at about $2.0 million for every +EPA per game, minus $170k.
For example, for a guy who produces 2.1 EPA/G, his going rate would be about $4M per year. So where would Ed Reed stand in this context?
Reed is a future Hall of Famer, but he is now 34 and headed into his twelfth season. Here is how his total production and per-game production have tracked over the course of his career. (Note that all stats are for regular seasons only. +EPA stats can be found here.)