Showing posts with label turnovers. Show all posts

Nick Foles and Interception Index Regression

Nick Foles and Josh McCown were two of last season's most pleasant surprises, emerging from obscurity to post two of league's most efficient seasons.  Both finished in the top 3 for Expected Points Added per Play, largely in part because the two combined to throw just three interceptions.

With one week of the 2014 season in the books,  Foles and McCown have already matched that combined total.  While everyone should have expected both to regress from their remarkably turnover-free 2013 seasons, that does not tell us how far each should regress based on historical norms.

How Important is Opponent Starting Field Position?

Earlier this season, I wrote a post about how San Francisco did an excellent job limiting their opponent's starting field position.  After a similar dominant performance against Pittsburgh in Week 15, I decided to revisit this topic.  This year, the 49ers lead all teams in average starting field position for their opponents; their opponents, on average, start at their own 24.4 yardline.  The next best teams? New England Patriots and Green Bay Packers.  In fact, this year, there is a 0.73 correlation between win percentage and average opponent starting field position.

But let's go back.  Since 2000, we see a 0.45 correlation between win percentage and average opponent starting field position.

Interceptions by Targeted Receiver

One thing I've learned to appreciate is how much interceptions can be the fault of the intended receiver. Whether it's a bad route, a misplayed tip, or a failure to fight the defender for the ball, receivers can often be as much if not more at fault than the passer.

We're always happy to list interceptions by quarterback or by defender, but rarely do we see interception stats by receiver. So I put one together. These are not interceptions I have qualitatively determined to be the receivers fault, but simply all interceptions when the receiver was listed as the intended target.

Selected Recap: Ravens 34, Jets 17: All The Turnovers


Sunday Night Football, ostensibly, gives a primetime view to what should be a great matchup between two of the league's top teams. Sometimes, this ideal is foiled by circumstances outside of the team's control -- take, for example, Peyton Manning's injury lowering the quality of Week 3's Steelers-Colts matchup. But sometimes, a good matchup is there, and both teams play ugly, ugly football.

This was certainly the case in Week 4's Sunday Night matchup, as both the Baltimore Ravens and the New York Jets combined to fail to produce a 100 yard runner or a completion percentage over 33%. Both teams did manage to produce seven turnovers, however. This was the source of Baltimore's big victory: three of the four turnovers forced by the Ravens' defense turned into six points on the other end.


How Random Are Interceptions?

One of the most random events in football is the interception. We can say that not just because of tipped balls or freak gusts of wind, but because we know that interception rates for teams and for individual quarterbacks varies widely from season to season. They also vary greatly from one half of the season to the next, which suggests that more is at play than player ability. In a recent post I estimated the proportion of team win-loss records that can be attributed to sample error in an effort to demonstrate the technique.

I looked at the interception rates (int per attempt) for all ‘qualified’ NFL quarterbacks since from 2002-2009. To qualify, a QB must have thrown a certain proportion of his team’s pass attempts. The overall average interception rate is 2.9%. The standard deviation, from QB to QB, is 0.94%, which means about 2/3 of the QBs will have interception rates that fall somewhere inside 2% and 4%.

To calculate the variance due to randomness, I couldn’t directly use the formula from the binomial distribution. Unlike team seasons, which all have 16 games, QBs have varying numbers of attempts during a season. Instead, I used a random simulation to estimate the random variance. I started with the premise that all interceptions were completely random. What if every quarterback’s pass attempts each had a 2.9% chance of being intercepted, regardless of who he is or who the opponent is. What would the distribution look like then? How different would this purely random distribution be from the actual distribution we observe in the real NFL?

Fumble Rates by Play Type

A lot of analysis of running vs. passing takes into account the added risk of interceptions. Almost all sources of passing stats will include team or player interceptions. But fumbles are more tricky. Stat sites will tell you team fumbles, but they usually won't tell you how many were due to rushes or due to passes.

Unlike interceptions, fumbles can happen on either type of play. But is the risk of a fumble even between runs and passes, or are fumbles more likely to occur on one or the other type of play? Further, what about fumbles lost? Are fumbles more likely to be lost on runs or passes? And how does the sack-fumble factor in?

More on the Cost of Interceptions

In a recent post I looked at the cost of interceptions in terms of equivalent yards and expected points. In this post, I'll look at them in terms of win probability added (WPA).

In a comment on my Fifth Down post regarding the context of Jay Cutler's 2008 interceptions, Will wrote:

"I know you can calculate a change in WP for a given play; this is how you came up with the best plays of the year for last season. Can you also calculate an average change in WP for a type of play? For example, can you find the average change in WP for a Cutler interception vs. a Favre interception vs. the league average, to see who throws more bad picks? I've long felt that many of Favre's interceptions equate to punts, as he throws it up deep on a late-down, long-yardage situation. By the same token, it might be good to know which passers have the highest delta-WP per attempt, or which rushers most change their team's fortunes per rush."

You can read my response in the original post, but I'll expand on it here. Will was getting a little ahead of me because I'm planning on publishing some neat stuff on individual player WPA (win probability added) later this season.

To make things a little easier on myself, I'll cite Bronco and Jet passing game numbers from 2008, not necessarily Cutler and Favre, but I think they're identical for practical purposes. I'll also calculate the league average.

Denver's 18 INTs cost a total of -1.56 WPA (or, in a sense, lost 1.56 games ). That averages to -.087 WPA/INT.

New York's 23 INTs cost a total of -2.49 WPA. That averages to -.108 WPA/INT. You could say that the Jets' interceptions were about 20% more costly than the Broncos' last year.

For reference, there were 465 INTs in the league in 2008, costing a total of -46.98 WPA. That averages to -.101 WPA/INT. So on average, an interception costs a team a 10% chance of winning. An interception equates to 3.8 points, 60 yards, or 10% WP lost.

Interceptions are not typically similar to punts. I've read elsewhere (I think at footballcommentary.com) that interceptions are on average returned to about the line of scrimmage. My data shows something slightly different. Interceptions are on average returned to within 8.1 yds of the original line of scrimmage. Removing the 2nd and 4th quarters from the data to account for Hail Mary interceptions, it's 7.2 yds. So, I suppose you could consider a typical interception like an incomplete pass and then a really, really short punt.

But WPA for any particular interception is dependent on a number of factors. Field position and score are obviously critical, so here is a graph of interception WPA by field position, broken out by selected score differences. Despite the noise in the graph, there are some points to be made.
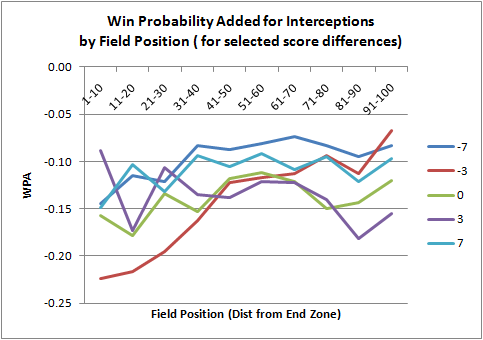

It's interesting how the WPA drops the steepest for when a team is down by 3 points (the red line). Throwing a pick deep in one's own territory when up by 3 points is nearly equally as costly. The bigger the difference in score, whether ahead by a lot or down by lot, the smaller the impact of the interception. The graph makes sense (at least to me)--it's what I'd intuitively expect.

Time is also critical. So here is the same graph, except limited to only 4th quarter interceptions. (WPA is a function of many things--score, time, fld position, down, to go distance--that I can't show everything on a single graph.) It's a little noisier, so I grouped the field position by 20-yard chunks instead of 10.
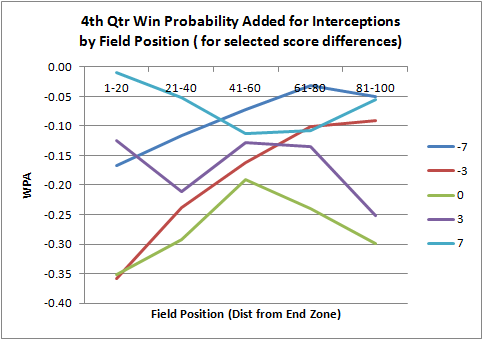

Again, we see what we'd expect. The tighter the score, the more costly the interception. Tied or down by 3 in opponent territory is where they're the costliest.

Adjusting Adjusted Yards Per Attempt

Reader Jeff Clarke sent me an email a few weeks ago asking about the interception yardage value used for the Adjusted Yards Per Attempt (AdjYPA) passing statistic. AdjYPA is total passing yards minus 45 yds for every interception thrown, divided by total attempts. It's a really handy stat because it encapsulates passing performance as a simple, single number, and better still, it's a rate stat.

The 45 yard adjustment number comes from the 1988 book Hidden Game of Football. The authors don't fully explain how they arrived at that figure, but I gather it was based on an analysis based on expected points. They do however, make a good intuitive case for it. An interception can always be thought of as costing any chance at a first down and precluding a punt. Punts net between 35 and 40 yds, and forfeiting a chance of the first down costs and extra few yards, which together comes to about 45 yds. Perfectly reasonable...for 1988.

Fast forward 21 years and the passing game, and offense in general, has become more potent. With offenses being more efficient, the value of having the ball is therefore greater, and turnovers would accordingly be more costly.

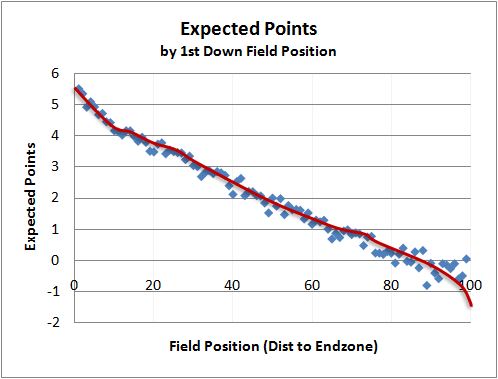
Jeff Clarke made a great observation. He wrote,"your own 15 yard line is the point of indifference. Holding everything else neutral, you are indifferent between having the ball at your own 15 and your opponent having it at his 15. Doesn’t this mean that the penalty for throwing an interception on first down should be 70 yards – the distance between the 15s?" (Expected Point curve below).


Jeff went on to point out that the cost of an interception would be less on 3rd and 15 than say, 2nd and 1 because the expectation of a first down is different for each situation. Jeff's analysis predicts that the true yardage equivalent would be something shy of 70 yds--the distance between the 15 yd lines. I was convinced to dig a little deeper.

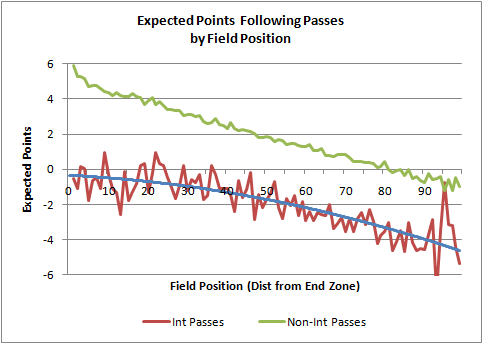
The average difference between interception plays and non-interception passes is 3.81 expected points. This is the weighted average for all plays on 1st, 2nd, and 3rd downs for all yard line. It accounts for return yards, and down & distance situation. I excluded 4th down passes, as those are often thrown in desperation situations, where high levels of risk are acceptable and the cost of the interception is not much different than a simple incomplete pass.

3.81 points equates to approximately 60 yards of field position. The graph below plots it nicely. The green line is the EP for non-interception plays, and the blue line is fit to the EP following interception plays.


EP is roughly linear away from the end zones. So if we look at the expected points graph for non-interception plays (the green line), +3.8 EP is at the opponent's 20 yd line. And the 0 EP point intersects at a team's own 20 (80 yds from the end zone on my graph). That's a difference of 60 yds.

60 passing yards is the modern interception equivalent of an interception, not 45.