
 NFL team efficiency rankings are back for 2008. The ratings are listed below in terms of generic win probability. The GWP is the probability a team would beat the league average team at a neutral site. Each team's opponent's average GWP is also listed, which can be considered to-date strength of schedule, and all ratings include adjustments for opponent strength.
Offensive generic win probability (OGWP) is based on each team's offensive efficiency stats only. In other words, it's the team's GWP assuming it had a league-average defense. DGWP is a team's generic win probability assuming it had a league-average offense.
GWP is based on a logistic regression model applied to current team stats. The model includes offensive and defensive passing and running efficiency, offensive turnover rates, and team penalty rates. A full explanation of the methodology can be found here. This year, however, I've made one important change based on research that strongly indicates that defensive interception rates are highly random and not consistent throughout the year. Accordingly, I've removed them from the model and updated the weights of the remaining stats. RANK TEAM GWP Opp GWP OGWP DGWP 1 
0.78 0.62 0.79 0.73 2 
0.72 0.53 0.73 0.58 3 
0.69 0.40 0.73 0.69 4 
0.66 0.58 0.65 0.72 5 
0.66 0.50 0.63 0.66 6 
0.65 0.49 0.77 0.53 7 
0.61 0.56 0.70 0.53 8 
0.58 0.56 0.54 0.56 9 
0.56 0.40 0.48 0.61 10 
0.56 0.54 0.56 0.60 11 
0.55 0.39 0.46 0.64 12 
0.55 0.55 0.49 0.69 13 
0.55 0.45 0.43 0.68 14 
0.54 0.54 0.39 0.60 15 
0.53 0.50 0.66 0.26 16 
0.52 0.54 0.41 0.59 17 
0.49 0.43 0.41 0.54 18 
0.48 0.49 0.54 0.37 19 
0.48 0.52 0.50 0.61 20 
0.47 0.38 0.58 0.41 21 
0.46 0.48 0.53 0.44 22 
0.45 0.54 0.57 0.32 23 
0.44 0.37 0.41 0.64 24 
0.44 0.49 0.42 0.49 25 
0.40 0.56 0.44 0.31 26 
0.39 0.45 0.41 0.53 27 
0.37 0.43 0.37 0.29 28 
0.35 0.63 0.51 0.27 29 
0.34 0.55 0.31 0.52 30 
0.30 0.53 0.20 0.37 31 
0.23 0.53 0.32 0.32 32 
0.20 0.53 0.33 0.15
To give everyone an insight into why the rankings are what they are, here are the team efficiency stats.TEAM OPASS ORUN OINTRATE OFUMRATE DPASS DRUN DINTRATE PENRATE ARI 7.5 3.2 0.028 0.032 6.4 4.0 0.017 0.40 ATL 5.6 5.6 0.019 0.005 5.9 4.6 0.031 0.40 BAL 4.6 3.9 0.025 0.029 3.7 3.1 0.059 0.48 BUF 6.6 3.5 0.017 0.019 5.1 4.2 0.025 0.24 CAR 6.2 3.6 0.008 0.021 5.1 4.1 0.008 0.51 CHI 5.4 4.1 0.033 0.023 5.3 3.7 0.028 0.40 CIN 4.4 3.5 0.048 0.039 5.6 4.3 0.009 0.37 CLE 4.0 3.5 0.051 0.024 6.7 4.1 0.057 0.52 DAL 8.2 4.9 0.029 0.031 5.9 4.2 0.000 0.53 DEN 7.9 4.7 0.025 0.029 7.8 5.0 0.007 0.24 DET 5.2 4.4 0.055 0.024 8.7 5.6 0.000 0.36 GB 6.5 3.9 0.023 0.043 5.4 5.2 0.057 0.64 HOU 5.4 4.2 0.045 0.033 7.0 4.8 0.013 0.18 IND 6.0 3.6 0.033 0.008 6.0 4.9 0.015 0.33 JAX 5.5 4.3 0.034 0.005 7.3 4.1 0.034 0.32 KC 4.1 4.9 0.045 0.026 7.0 5.3 0.018 0.22 MIA 6.2 4.4 0.010 0.028 7.4 3.3 0.012 0.39 MIN 5.2 4.7 0.023 0.025 6.1 2.9 0.016 0.40 NE 5.2 3.9 0.011 0.020 6.9 5.0 0.026 0.14 NO 8.6 3.4 0.027 0.023 6.4 5.2 0.027 0.55 NYG 6.6 5.4 0.009 0.006 4.5 3.8 0.010 0.47 NYJ 6.4 3.8 0.039 0.021 6.6 3.1 0.034 0.34 OAK 5.6 4.8 0.010 0.041 6.1 4.0 0.039 0.50 PHI 6.7 3.5 0.019 0.023 5.5 2.6 0.033 0.35 PIT 5.5 3.4 0.021 0.037 4.4 2.9 0.045 0.35 SD 8.5 3.9 0.036 0.016 5.9 4.5 0.029 0.25 SF 6.6 4.7 0.027 0.037 6.0 4.0 0.038 0.35 SEA 4.9 4.9 0.031 0.013 6.5 3.5 0.011 0.42 STL 4.8 4.0 0.025 0.024 8.2 4.7 0.009 0.43 TB 5.3 5.0 0.041 0.010 6.1 3.6 0.061 0.55 TEN 6.3 3.8 0.029 0.024 4.5 3.7 0.056 0.31 WAS 6.3 4.3 0.000 0.000 5.9 4.3 0.034 0.32 AVG 6.0 4.2 0.027 0.023 6.1 4.1 0.027 0.38
Week 4 Efficiency Rankings
Home Field Advantage by Quarter
 In his 2007 paper Home Advantage in the NBA as a Game-Long Process, Marshall Jones found that home court advantage in the NBA is not consistent throughout a game. Instead, it's disproportionately realized in the 1st quarter. The home advantage diminishes in the 2nd and 3rd quarters, then is smallest in the 4th quarter. He also found that when home teams enter a quarter behind, they tend to substantially outscore their visiting opposition. So how about in the NFL?
In the NFL, home teams also enjoy an advantage, although not as large as in the NBA. HFA is commonly thought of as about 3 points or so, and home teams win 57% of regular season games.
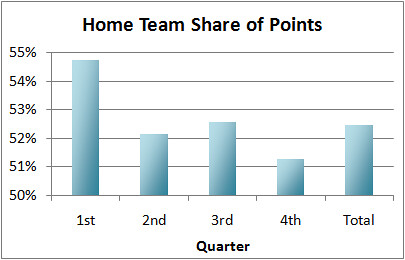
Below is the breakdown by quarter of the home team's share of points.
Overall, home teams score 52.5% of all points through the entire game. By far the largest advantage is seen in the 1st quarter, when home teams score 54.7% of the points scored during that period. The 2nd and 3rd quarters see a significant drop off, followed by the 4th quarter which shows the smallest advantage.
So just like the NBA, HFA in the NFL is primarily realized in the 1st quarter. Now let's compare how home teams fare when behind or ahead.
When trailing, home teams show the same pattern as the overall share in the 1st graph. But when ahead, home teams show no pattern, scoring about 59% of the points in each quarter. So there is a difference in the HFA effect not only by quarter, but by score difference as well.
Note that although trailing home teams score fewer than half of all points, this is what we'd expect. A team that's behind is likely the weaker team, so we would not necessarily expect them to outscore opponents, whether at home or not. This would not mean there is a home field disadvantage.
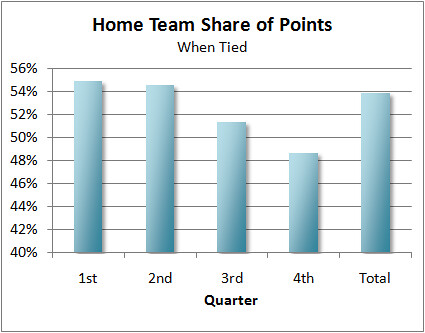
With that in mind, we can just look at points scored when the game is tied to (partially, at least) account for bias due to team strength.
Again, we see HFA diminish through the game. In fact, home teams score only 49% of points in the 4th quarter. My guess is that home teams that are tied in the fourth quarter have enjoyed 3 quarters of HFA, so they would tend to be the slightly weaker team without HFA. And since HFA becomes weakest in the 4th quarter, we're still seeing some bias due to team strength. In other words, it's better to be good than to be at home, especially in the 4th quarter. This is more than just random trivia. Understanding how strong HFA is throughout the game helps us understand where HFA comes from. For example, as Marshall points out in his paper, it was commonly thought that HFA comes mostly from the crowd. It was expected therefore, that HFA would be strongest in the 4th quarter when crowds are typically loudest and most involved in the game, especially when the score is close. Also, if travel fatigue is the cause, then we'd expect HFA to be strongest toward the end of the game when fatigue becomes most important. But we see that the opposite is the case, so HFA may come from somewhere else.
I think there are probably multiple processes involved. There could be game-long effects, such as the crowd, but then there could be another process that diminishes as the game progresses. But whatever the underlying causes, HFA is strongest at the beginning of the game and diminishes as the clock winds down.

In-Game Win Probabilities Beta
 Today I'm testing a real-time win probability site. The status of each ongoing game will be reported along with the probability of winning for each team. The probabilities are based on over 2000 games from the past 8 regular seasons. For now, the model is fairly basic and considers score, time, and possession. Modifications for field position, down and distance, and other factors are in work. It's an extremely challenging project, to say the least. But even now, the model is very revealing.
But for now, readers of this site are invited to check out the beta version during the games today. Be warned there will certainly be hiccups, bugs, and other problems throughout the day. So if it's not working one minute, it may be back up the next. It goes live shortly after the 1 o'clock kickoffs today. Comments and suggestions are more than welcome!
The link is wp.advancednflstats.com.
(Be patient. It's a very slow homemade server.)
Game Probabilties Week 4
 Win probabilities for week 4 NFL games are listed below. The probabilities are based on an efficiency win model explained here and here with some modifications. The model considers offensive and defensive efficiency stats including running, passing, sacks, turnover rates, and penalty rates. Team stats are adjusted for previous opponent strength.
Pwin Visitor Home Pwin 0.47 0.53 0.35 0.65 0.21 0.79 0.38 0.62 0.61 0.39 0.44 0.56 0.72 0.28 0.36 0.64 0.64 0.36 0.72 0.28 0.56 0.44 0.46 0.54 0.36 0.64