
 No, not that kind of football.
A couple weeks ago I wrote a post about how underdogs can increase their chances of winning by employing a high-risk, high-reward strategy. It seems that’s just what the US soccer team did in their recent upset against the globe's top team, Spain.
According to this analysis by the Journal’s Carl Bialik, the American team uses long aggressive passing, looking for fast-break scores, instead of using a more typical ball control offense. This opens up opportunities for a quick goal, but usually results in the opponent controlling the ball on the US side of the field (or pitch, if you’re a ‘football’ aficionado). As long as the goalie has a good game, and the defense gets some breaks, the strategy works.
It makes sense because the US team has nothing to lose. No one expects them to go very far in World Cup play, so they can afford to use a risky gameplan without being humiliated if they end up losing 4-0.
An Underdog Wins with Aggressive, Risky Football
Why There Is So Much Holding
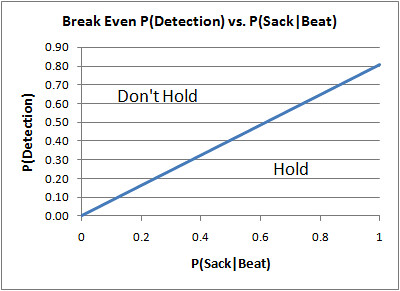
So assuming that a defender that beats his blocker would always sack the quarterback, the blocker should hold him whenever he believes the probability of detection is lower than about 0.81. In other words, he'd get away with it 1 out of 5 times. It's understandable why a blocker would intentionally hold a pass rusher in this situation. The bottom line is that the probability of detection at which committing holding is worthwhile is when it is about 4/5 the chance a pass rusher will get a sack if he beats his blocker. For argument's sake, say that a pass rusher in the backfield gets a sack half the time. The probability of detection would need to be below 0.4 for the hold to make sense. It all boils down to the graph below: So all a blocker needs to do is quickly solve the equation above immediately after the snap, given his estimate of...I'm just kidding. Of course I don't expect anyone to use math to make decisions in the heat of battle, but this analysis does explain one reason why we see so much holding. There are other complicating considerations too. A pass rusher could miss the sack but hurry the pass, causing an incompletion or worse. There are all kinds of possibilities. But ultimately, despite the apparent harshness of the penalty, the infraction is not always called, and in many cases can be worth the cost. Nothing upsets a coach more than a offensive holding call in the middle of an otherwise productive drive. The play, usually a good one, is nullified, and the penalty moves the line of scrimmage back 10 yards. What was a promising 2nd and 5 becomes a difficult 2nd and 15.
Yet holding calls are frequent, which suggests there's obviously something useful about holding. For passing plays, the alternative is often a sack, which is bad in all kinds of ways. Plus, not all instances of holding are called. I'm sure if you polled defensive lineman, they'd say less than 10% of holds are actually flagged.
So I wanted to know, "for passing plays, what's the break-even detection rate for a hold which would make it worthwhile?"
It's a complex question with lots of variables, so let's isolate some. First, let's define the utility of "worthwhile" as based on the probability of converting a first down. Consider a general 2nd down and 5 situation. Typically, an offense in that situation that calls a pass will convert for a 1st down 71% of the time. We'll note this as P1D = 0.71.
An offensive holding penalty negates the play and penalizes 10 yards from the previous spot, forcing a 2nd and 15. That makes the chances of a 1st down considerably lower. The probability of a 1st down "given a hold" is P1D|Hold = 0.20. For all 2nd and 5 pass plays in which there was no sack, the probability of conversion is P1D|NoSack = 0.73. But for all 2nd and 5 plays that resulted in a sack, the probability of conversion is P1D|Sack = 0.30.
In order of preference, you'd rather have neither a sack nor a hold (0.71), then a sack (0.30), and lastly a hold (0.20). But not all holds are called. I'm not sure what the detection rate really is, but we can solve for what detection rate would make a hold worthwhile.
For now, let's assume that if the pass rusher beats his blocker, he will cause a sack 100% of the time. And let's call the ref's holding detection rate "x." The break-even detection rate could be found with a simple linear equation:
Solving for x, we get:
.20(x) + .73 - .73(x) = .30
-.53(x) = -.43
x = .81
But pass rushers who beat their blockers don't sack the QB 100% of the time, so let's generalize the equation. Call the probability of a sack given the defender beats his blocker "y." The break-even equation now becomes:
Simplifying, we get:
.20(x) + .73 - .73(x) = .30(y) + .73 - .73(y)
-.53(x) = -.43(y)
x = .81(y)
Note: Data is from the 1st quarter of all NFL games 2000-2008. Other quarters are excluded to eliminate the effect of "end-game" plays--hurried plays at the end of the halves, desperation plays by trailing teams, and clock-burning plays by leading teams.
Best Games of the Decade
 Now that all NFL games since 2000 have been added to the Win Probability Archive, we can step back and take an inventory of some of the more special games in recent years. I've created a simple search tool for finding many of the most compelling games of the decade.
There are many things that make a game special. Any game with playoff implications is more interesting than one between mediocre teams, and playoff games themselves are obviously critical. But many of those games are just plain boring. They're sometimes duds, decided by the end of the 1st quarter.
I wanted to know what the most exciting games were purely between the sidelines, what were the biggest comebacks, and which teams played the most dramatic football. That's why I created two new indices--Excitement Index (EI) and Comeback Factor (CBF). Admittedly, these stats are purely from a spectator's perspective, and would have very little application to the game itself. But hey, it's fun.
Comeback Factor
The comeback index was easy. For any given game, the 'CBF' is based on the lowest win probability at any point for the ultimate winner. To make bigger comebacks have bigger CBFs, I made CBF be the inverse of the lowest WP.
For example, if a team is down by 10 with 10 minutes left in the 4th quarter, they'd have around a 0.13 WP. This means the trailing team has a 1 in 8 chance of winning, and the CBF is therefore 8. A team that comes back from a 0.01 WP, would have a CBF of 100, the largest possible.
You might be tempted to say that CBF should factor in the lateness of the comeback. Certainly, a comeback in the final minutes is more dramatic than one staged in the 3rd quarter. I agree, however WP already factors that in. A 17-point lead in the 2nd quarter has an equivalent WP as a 2-point lead late in the 4th quarter.
Excitement Index
"Excitement" was harder to measure. Unlike measuring comebacks, there is no single true measure of excitement, and different people can have different definitions. I tested a few different methods, including several suggested by commenters, and ultimately chose a method that I think is both effective and straightforward.
EI is simply the sum of the WP graph's movement throughout a game. That's it. Despite the simplicity, this method captures much of what makes a game interesting. Games with large swings in WP will end up with large EIs, while blow-out games where the WP quickly climbs to 0.95 for one team will have smaller EIs. That same blow-out, but where the trailing team climbs back into contention will have a larger EI. (Credit goes to eje100, JMM, and NeilC for first suggesting similar methods.)
What about measuring closeness? The closeness of a game is obviously an important part of how compelling it is. And EI captures that too. The closer the game is to a 0.50 WP, the more magnified the WP movement becomes for any given play. For example, a 40-yd pass to the 10 yd line when the score is 30-6 is going to move the WP by barely 0.01. But that same play when the score is tied will move the WP by 0.25 or so, depending on the time remaining.
But games with more plays will obviously have a higher WP. Shouldn't EI account for the number of plays by using the average WP movement? I say no. A fast pace helps make a game exciting. Offenses furiously trying to score as quickly as possible is fun to watch. Pace counts. Plus, overtime games would tend to have the most plays, and therefore the higher EIs. And that's what we'd expect from an OT game. If 'sudden death' is anything, it's exciting to watch.
The Best Games
Below is the search tool, and here is its permanent home. Just enter a year, a team, and whether you want to rank games by excitement (EI) or comeback (CBF). Or you can select 'any year' or 'any team' to find the most interesting games for the entire league in any year, or for the entire decade.
The most exciting game of the decade? Would you believe a meaningless 13-10 game in December 2000 between the Bills and Patriots? Neither would I, until I saw the graph. Happy clicking...
Final Season Added to the Archive
The 2000 season has now been added to the WP Graph Archive. That's the earliest season for which I have data, so that will be the last addition.
Next up will be a search tool for finding the most exciting games or games with the biggest comebacks, according to team, year, or both (or for the entire decade). I've also done some analysis to judge the accuracy and calibration of the underlying model itself, which I'll publish soon. The initial results are very solid.
2001 and 2002 WP Graphs Added
WP Graphs for the 2001 and 2002 seasons are now available. (Check out the Pats dramatic Super Bowl win over St. Louis with the Adam Vinatieri FG in the closing seconds. In actuality, New England had the game in hand throughout the second half, and never had less than a 50% chance of winning since Ty Law's interception return for a TD in the 2nd quarter.)
That brings the archive to all games from 2001-2008. Only one more season to roll out. Also, I'm currently testing a simple search tool to list and rank games by their "excitement index" or "comeback factor." For example, you could list the most exciting games by your favorite team in the decade, or the biggest comebacks by any team in 2008, and so on.
Back Online, 2003 Added, and NBA Tonight
Comcast knocked out my server while I was out of the country on business earlier this week, so my apologies to everyone who linked to the NFL win probability archive. I'm pleased to report it's back up and running now.
I've added the 2003 season, so that covers every NFL game from 2003 through 2008. The 2000 through 2002 seasons will be added soon.
Also, don't miss the live NBA probability graph for game 4 of the finals tonight.
Two More Seasons Added
All games of the 2004 and 2005 NFL seasons are now charted and available. Win Probability graphs for the entire 2004 through 2008 seasons can be found at wp.advancednflstats.com/nflarchive.php.
Full 2006 Season Now Available
Another day, yet another year of games added. Win Probability graphs for the entire 2006, 2007, and 2008 seasons are now available at wp.advancednflstats.com/nflarchive.php.
Win Probability Graphs: 2007 Playoffs
 +0.19 for Tyree’s catch.
+0.41 for the TD pass to Burress.
Sadly, no one will remember the 2-yd gain by Jacobs on 4th and 1 to keep the drive alive, but that play had a Win Probability Added (WPA) of +.21. If Tyree doesn’t make the catch, the drive is still alive--it was ‘only’ 3rd down. If Jacobs is stuffed—that’s all she wrote.
Of course, there’s no good way to quantify the style points for Tyree’s miraculous grab or Manning’s escape from the sack.
One of my major goals this off-season is to create win probability graphs for every NFL game since 2000. I'm starting with the 2007 playoffs, one of the most improbable championship runs ever. The New York Giants defied the odds in four consecutive games, never once favored to win. Yet somehow they slayed the dragon, the sport's most formidable offense in its history.
I'll be rolling out more than 2000 games over the next several days. Each graph has complete play-by-play descriptions. Just roll your cursor over the graph.
Also included are some new statistics. Comeback Factor (CBF) is simply the odds against the team that ultimately wins at their darkest moment. Excitement Index (EI) [boy, does that need a better name--I'll take suggestions] is how exciting the game was. Think of it as an EKG or Richter Scale for a game. It's the sum of all the movement in the graph. Blowouts are flat-lines and have relatively no movement, while close, high scoring games are the most exciting. Close, but low scoring games will be right behind.
In the play-by-play descriptions you might notice a stat labeled "LI." That's the Leverage Index, a concept borrowed from the sabermetric community and Tom Tango in particular. LI measures how crucial a particular game situation is toward the outcome. This should be an interesting new way to look at each play, and I'll explain it fully in a forthcoming article.
For now, keep the year menu on 2007. The playoff teams that year were the Colts, Pats, Giants, Jags, Titans, Steelers, Packers, Seahawks, Redskins, Cowboys, Bucs, and Chargers.
There are still a few hiccups with the graphs, usually due to errors in the NFL gamebooks I use to create them. Comments and suggestions are more than welcome.
wp.advancednflstats.com/nflarchive.php
Injury Rates and An Extended Season
 At the recent owners meeting, the NFL disseminated a study that concluded an increase in the season schedule from 16 to 18 games would not increase injury rates. The report caught a lot of criticism as a halfhearted attempt to obscure the toll a longer season would take on the players. Judy Battista of the New York Times and Mike Reiss of the Boston Globe both point to flaws in the study.
But I suspect there is a fundamental misunderstanding about what the report says and how it's being interpreted. All I really know about the report is that it says, "the NFL's injury rate doesn't increase at the end of the season." There is no doubt a longer season would result in more total injuries. The bigger question is how many more injuries--does the injury rate itself increase?
Much of the criticism of the study focuses on the use of team injury reports, well known for their deceptive omissions. In an excellent article, Bill Barnwell at Football Outsiders found an additional flaw in the study. It left out players who go on the IR. Before you consider players on the IR, it appears that the injury rate peaks at week 10 before it decreases for the remainder of the season. Barnwell explains why this isn't really the case.
Since team injury reports are notoriously unreliable, the best information is actual games missed. Thankfuly, Barnwell provides that data in his article, and it's very interesting stuff. When you factor in the IR, the number of games missed climbs steadily. He concludes, "the data looks totally different, and in a bad way for the NFL..."
The way I see it, however, is that the NFL report is right, no matter what the intent was of its authors. There is no increase in injury rates toward the end of the season. The injury rate is effectively linear. Of course, as the season wears on, the number of players unable to play due to injury will accumulate, creating an upward climbing injury total. Once you go on the IR, you don't come off. This cuts to the heart of the debate about whether players become increasingly susceptible to injury as the season, along with the number of cuts and collisions, wears on.
Here is a graph of the data included in the Barnwell article.
The blue line is the games missed by roster players (those not on the IR). Except for the uptick on the final week, when playoff bound players nurse their wounds and everyone else has their bags packed for the Caribbean, it's very steady. The green line is the number of games missed by IR or physically unable to perform (PUP) players. Note how its slope steadily increases. The red line is the combination of the injured roster players and IR/PUP players.
Here's what I take away from this data. Players on the IR increase at a (very) slightly exponential rate--specifically it's:
That .006 term is extremely small, and when combined with the negative camber of the blue line, results in a very linear total, (especially when week 17 is thrown out, although you don't need to.) [Note: By the way, the slight non-linearity of the increase is evidence, however tiny, for the notion that players become more susceptible to injury as they endure the season.]
Ultimately, the total number of players who miss games due to injury is indistinguishable from a linear line (r-squared of .97). Its increase is exclusively due to players going on the IR, which is a one-way check valve.
So will there be more players missing games at the end of the season if the NFL adds two more games? Of course. But it won't be Iwo Jima out there. No explosion of wounded players with "cascading" injuries. It will be a demanding, grueling, even cruel extra two games for the players, but it would barely be noticeable to the fan and to the game itself. I suspect that's what the NFL report is trying to spell out. Even counting the uptick in the final week, each team would average an extra half a missed player by a potential week 19.
Personally, I'm against lengthening the season for a lot of reasons. The nerdiest is that there is a mathematical elegance to 2 conferences, 4 teams per division, 8 divisions, 16 games, 32 teams, and 256 games per season. Please, no 17th game or 33rd team--I'd have to redo all my algorithms and equations! Actually, I just think 16 is plenty. The fewer the number of games, the more unpredictable the season, and I like that.
