
 This is my favorite post of the year. It's an annual opportunity to look back over all the interesting analysis, features, visualizations, and analytical tools we've been able to put together at ANS. Great thanks to Keith Goldner, Dave Collins, Sterling Xie, Rob Hendryx, and Kevin Meers for making 2013 another successful year. (Here are the best-of posts of 2009, 2010, 2011, and 2012. They're a great way for new readers to come up to speed.)
I said this last year and I'll say it again. With each passing season I start to feel like we've peaked. Maybe all the low-hanging fruit of football analytics has been plucked, and there's little left to do but become a broken record on a handful of subjects. But this stuff is too much fun to give up. And so sure enough, over the course of another season we stumble on a few more insights and push the envelope just a little further. And interest continues to grow too. 2013 was the best year yet in terms of traffic to the site, and December was the site's best month ever.
With every new feature, ANS becomes a little bit harder to run throughout the season. So please forgive me as I take a breath, step back and highlight some of what we consider some of our favorite stuff. Of our 219 total posts in 2013, here are a few of the best...
With the AFC playoffs appearing to go through Denver throughout last January, I took a look at the effects of altitude on FG success.
Keith analyzed John Fox's decisions in his team's upset at the hands of the Ravens. Here are my own two cents in a post at Slate and Deadspin.
I finished up the series on when to intentionally allow a TD with a look at what the numbers say for when teams are tied. This was possibly the most challenging bit of analysis I've done, and it spawned the time calculator tool, which got a major upgrade last January.
I took a look at how much QB clutch performance persists from season to season.
February started with a look at how Joe Flacco's magical post-season over-performance compared to that of other QBs in the recent past.
The Super Bowl was one of the more interesting and exciting championship games in memory. It featured a fake punt, an intentional safety, and a couple crucial 4th down decisions. It was also a case study in saving your timeouts.
Best of 2013
Chargers Courageous Call & Playoff-Clinching Drive
 Despite the controversy surrounding an illegal defense on the Chiefs' missed field goal at the end of regulation, the San Diego Chargers defied odds and clinched a postseason berth on Sunday. In overtime, Philip Rivers orchestrated a 17-play, nine-and-a-half minute field goal drive to start the extra quarter that ultimately sealed their win. The length of the drive, in this case, is just as important as the outcome as San Diego could advance with either a win or a tie.
Using our Markov model, let's take a look at the drive. Keep in mind, the model is best used for a standard drive when time and score differential would not greatly affect decision-making or play-calling. Since this was the opening drive of overtime, those standards will predominantly hold true, although not perfectly given the leverage of the situation.

Sunday's Numbers Have Been Crunched

Advanced stat box scores
Top QBs of the week
Top RBs of the week
Top WRs of the week
Top TEs of the week
Top Defenders of the week
Advanced team stats
Offensive player season leaders
Defender season leaders
Team Viz
Position Leaders Viz
QB Viz
RB Viz
Amazing Sunday
Here are my quick hit observations on week 17 of the 2013 season.
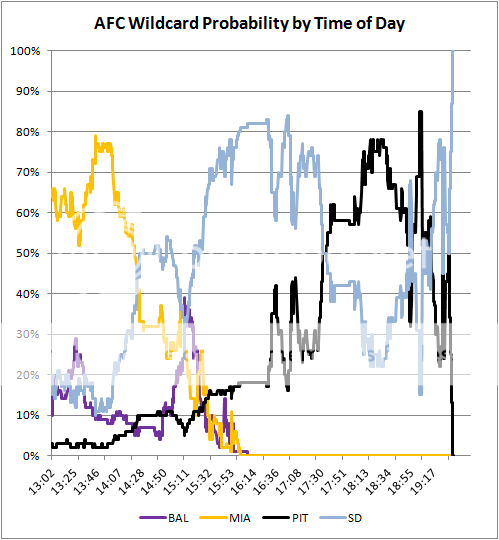
AFC Wildcard Probabilities Through 4pm
Not much to add here. The graph says it all. Sorry, Dophins fans. And I was getting my own hopes up right around 3:15. Don't forget--live playoff probabilities all day today on the main page.

Live Playoff Probabilities Today

But wait, there's more! If you call now, I'll throw in a free overall-first-draft-pick probability.
With all the games that have playoff implications, this should be a lot of fun today, especially during the 1pm games. But this is something that's only useful one day out of the entire season, so please don't wait to spread the word: Tweet
A few notes about the playoff probability widget:
Tony Romo and High Variance QBs

Romo has a reputation as a choker, mostly due to his team's late-season under-performance. But taken as a whole, his numbers are very "clutch." He has ranked 8th, 5th, 6th, 3rd and 12th in QB WPA over his last 5 (non-injury seasons). I don't buy the choker label, but I do buy the notion that he's a gambler and an improviser, which can cause wide swings in his game-to-game WPA numbers. So I thought I'd pull the stats and investigate how Romo compares in terms of his game-wise variance.
Variance measures how wildly a stat changes. In this analysis, I measured the variance of week-to-week WPA. If a player has lots of heroic games and lots of calamitous games, his WPA variance will be high. If a player is relatively consistent from week-to-week, regardless if he is consistently good or consistently bad, his WPA variance will be low.
For those who are unfamiliar, variance is an average of the squared deviation from each player's mean WPA. For statistical sticklers out there, I used variance of a population rather than variance of a sample--otherwise players with relatively few starts would have a slightly inflated result.
This season, Romo ranks only 14th in game-to-game WPA variance out of the 41 QBs with 200 or more qualifying plays. He's also 14th over the past 5 seasons. If we go back to 1999, the earliest year of my data, he ranks 9th out of the 101 QBs with 800 or more qualifying plays. His early career was apparently very boom-and-bust.
Here are a three tables of QB WPA variance. The first is for the 2013 season through week 16. The second is for the last five seasons. And the third for the period 1999-2013.
Podcast Episode 14 - Chase Stuart
Chase Stuart returns to the show just in time to discuss his latest Football Perspective research. Dave and Chase begin by breaking down the historical context of Peyton Manning's single season passing touchdown record. They then cover the Carolina Panthers and break down the changes they’ve made over the past year, the storylines surrounding Cam Newton, and how overall team performance can sometimes obfuscate an individual player's development
Next, Chase takes to his soapbox to make the case that the Jets should fire Rex Ryan and explains how retaining him would set a unique historical precedent. Next, they turn their sights to the Giants and discuss what to make of Eli Manning’s interception spike.
The episode concludes with a look ahead to the week 17 Bears/Packers and Cowboys/Eagles matchups. Chase weighs in on what he’s most excited for in this year’s playoffs, and why playing a Superbowl outdoors might actually be more fair than playing in a dome.
Subscribe on iTunes and Stitcher
Game Probabilities - Week 17
 Game probabilities for week 17 are available at the New York Times. This week I take a look at the narratives surrounding Tony Romo.
...However, the part of the story line that’s true is that Romo is a boom-and-bust performer. He can both lead his team to a dramatic victory, as he did last week in Washington, or make bone-headed plays to let victory slip from his team’s hands, as he did the week before in Green Bay.
Of all the quarterbacks with over a full season worth of pass attempts since 1999, Romo ranks 15th out of 152 qualified players in the game-by-game variance of WPA, which measures how far apart the peaks and valleys in a statistic tend to be...
Team Efficiency Rankings: Week 16

Well, technically there are still four more playoff spots available. However, the Saints only need to beat the 4-11 Bucs at the Superdome to secure a wild-card berth (or better, if Carolina somehow stumbles against Atlanta). And though Dallas is actually hosting Philly in their annual NFC East championship clash, Tony Romo's back injury is a devastating blow for an already inferior team.
But the NFC North crown and the AFC sixth seed are much more competitive races. Picking a team to win one of the last two golden tickets isn't simple, and among the six teams in contention, the one most likely to inflict damage in January is the least likely to make it that far.
PIT Should Not Have Scored the TD

But GB jumped offside on the FG attempt, and gave PIT a 1st down and goal from the 5 with 1:35 to play. Now GB had only 1 timeout left, and it would have certainly made sense for PIT to refrain from scoring the TD, burn time off the clock, and kick an easy FG for the win.
The chart below illustrates when a defense would prefer to allow a TD. The black diamond represents the state of the game at the 1st and goal mark assuming PIT does not score a TD. The black line shows the win probability of the defense if they allow the TD.
Sunday's Numbers Have Been Crunched
Advanced stat box scores
Top QBs of the week
Top RBs of the week
Top WRs of the week
Top TEs of the week
Top Defenders of the week
Advanced team stats
Offensive player season leaders
Defender season leaders
Team Viz
Position Leaders Viz
QB Viz
RB Viz
Lambeau Madness & Twitter Outcries
With a little over five minutes remaining in the 3rd quarter, down 17-14 to the Steelers, the Packers had their field goal blocked only to have chaos unleashed at Lambeau. I won't go into the details, but essentially it was ruled that the Steelers never had full possession (when they did and should have been determined down by contact) and then due to an illegal batting out of bounds, the Packers got the ball back with a fresh set of downs, 1st-and-Goal from the 2-yard line.
All holy heck has broken loose in Green Bay.
— Rich Eisen (@richeisen) December 22, 2013
Twitter erupted. Everyone was outraged at the blasphemous call. And even more, everyone was outraged that possession was an unchallengeable call. All over the place, people were comparing it to the Seattle/Green Bay replacement ref debacle from last season.
Four Fourth Quarter Fourth Down Decisions
 With a loss to the Redskins on Sunday, the Dallas Cowboys would leave themselves vulnerable to being eliminated from the playoffs by an Eagles win on Sunday Night. Heading into the fourth quarter, Tony Romo and company trailed 23-14. Starting from their own 20-yard line, the Cowboys drove to the Washington 35 before facing a 4th-and-1.
Fourth Down #1:
4th-and-1 converts around 70% and results in 22% win probability on a success and 7% win probability on a failure. E[WP] = 18%
In 2013, a 52-53 yard field goal converts about 62% and results in 17% win probability on a success and 6% win probability on a failure. E[WP] = 13%
E[WP] for a punt is a mere 9%.
Jason Garrett decided to go for it, this was the right decision. Unfortunately, Doug Free moved early forcing a 4th-and-6.
Playoff Projections - Week 15
All of the numbers below come from Chris Cox at NFL-forecast.com. His app uses the win probabilities from the ANS team efficiency model to run a Monte Carlo simulation of the remaining NFL games thousands of times. Based on current records, our estimates of team strength, and knowledge of the NFL's tie breaking procedures we can come up with some pretty interesting predictions of how each team will fare come the end of the season. If you want to use a different model or just fiddle with the numbers by hand, go ahead and download the app yourself.
Week 15's biggest movers
All of the major action this week was in the NFC North. Detroit fell a huge 51% due to their loss to Baltimore, which was compounded by victories for Green Bay and Chicago. All 3 games were decided by 7 points or less. With a little more luck Detroit could have been a huge favorite in the division at this point; instead, they are in 3rd with a 20% chance. Because the Packers and Bears both have superior records and play each other in week 17, the Lions would be eliminated from playoff contention with a loss in either of their remaining games.
Week 16 Game Probabilities
Game probabilities for week 16 are available at the New York Times. This week I take a look at how to measure the playoff impact of individual games for both conferences.
...As the playoff field narrows with two games remaining, we can use what’s known as a Monte Carlo simulation to play out the remainder of the season several thousand times, weighting the game outcomes according to the game probabilities produced by the Advanced NFL Stats efficiency model...
Podcast Episode 13 - Harold Sackrowitz
This week Harold Sackrowitz, professor of Statistics at Rutgers University and author of "Refining the After-Touchdown Decision" joins Dave to discuss two point conversions. Harold first became interested in football analytics in the mid-90's when he and his son penned a paper on ball control, and whether the strategy of paying "keep away" from talented opposing offenses is an effective strategy (spoiler alert: it's not). His research found that an inferior team sacrificing offensive efficiency would require an unrealistically large reduction in the number of possessions to make a "ball-control" offensive strategy effective.
In the second half of the interview, Dave and Professor Sackrowitz talk about his paper on two point conversions. Harold was initially intrigued by repeated mentions of "the 2 point chart" on television broadcasts, and after digging up "the chart" he found it to be lacking in detail and context. To fix it, he devised a dynamic programming model to incorporate score differential, the number of possessions remaining in the game and a particular team's chance of converting a two point play. With this model he created a series of new charts to more accurately fit a variety of two point decision situations. Harold also describes the responses he's received and the subsequent conversations with NFL decision makers about his work.
Subscribe on iTunes and Stitcher
Team Efficiency Rankings: Week 15

Of course, whatever momentum may or may not exist is totally irrelevant if the team does not actually make the playoffs. The playoffs reward the teams that have performed best over the course of a 16-game season, but due to injuries and player development, the 16-game sample does not really accurately reflect team strengths by the end of the year. It's why Football Outsiders has weighted DVOA to quantify a team's recent performance.
Looking at the second half of the season (since Week 9, though bye weeks make it tough to neatly divide up the schedule), we can see that one of the best second-half teams is highly unlikely to make the playoffs, and one of the worst is already in:

So what's changed?
Did Shanahan Make the Right Decision to Go for Two?

Sunday's Numbers Have Been Crunched
Advanced stat box scores
Top QBs of the week
Top RBs of the week
Top WRs of the week
Top TEs of the week
Top Defenders of the week
Advanced team stats
Offensive player season leaders
Defender season leaders
Team Viz
Position Leaders Viz
QB Viz
RB Viz
Philbin Shows Up Phil
 In a huge division game with significant playoff implications, the Dolphins trailed the Patriots 20-17 with a little over three minutes remaining and three timeouts in their back pocket. Facing a 4th-and-5 from their own 45-yard line, Jim Nantz asked Phil Simms whether he would punt in that situation, to which Simms replied "Absolutely, punt it!" The logic here is that with three timeouts remaining, the Dolphins could stop the Patriots and force a three-and-out, getting the ball back with another chance to drive down and tie or win the game.
Let's look at the baseline win probability numbers:

Game Probabilities - Week 15
Game probabilities for week 15 are available at the New York Times. This week I note the high playoff leverage of the NE-MIA game.
Playoff Projections - Week 14
All of the numbers below come from Chris Cox at NFL-forecast.com. His app uses the win probabilities from the ANS team efficiency model to run a Monte Carlo simulation of the remaining NFL games thousands of times. Based on current records, our estimates of team strength, and knowledge of the NFL's tie breaking procedures we can come up with some pretty interesting predictions of how each team will fare come the end of the season. If you want to use a different model or just fiddle with the numbers by hand, go ahead and download the app yourself.
Week 14's biggest movers
Dallas took a major hit by losing to Chicago. Coupled with Philadelphia's win against Detroit, this caused the Cowboys' playoff odds to drop 18%.
San Francisco's big win over the rival Seahawks propelled them to their current 93% playoff probability. The jump came mostly at the expense of the Panthers, who lost their big rivalry game against the Saints. The Saints are now one game up on the Panthers and considered a much better team by the ANS model, so a New Orleans divisional championship is now deemed 95% likely.
Podcast Episode 12 - Brian Burke
Brian Burke is back on the show to break down his latest work. He explains the details of the updated win probability formula and the story behind the brand new New York Times 4th Down Bot. Dave and Brian also discuss his latest post analyzing "streakiness" and how it can measure momentum.
They then dive into the wildly entertaining week 14 slate of games, beginning with a look at Keith Goldner's intentional touchdown post and a review of the best (Matt Prater) and worst (Philadelphia/Detroit) of the week 14 kicking game. Brian lays out the interesting math behind the Alabama/Auburn missed field goal return, and how the analysis behind it presents some tricky challenges. The show ends with a look at late season winter weather, and how it may affect teams as they prepare to battle for the chance to play outdoors in this year's New York Superbowl.
Subscribe on iTunes and Stitcher
Team Efficiency Rankings: Week 14

Of course, the top two seeds rarely meet in the Super Bowl. The Colts-Saints matchup was the first one since 1993-94, when the Bills and Cowboys faced off. Right now, it looks like a stretch envisioning either team falling at home, though the postseason's one-and-done format certainly helps. Taking a closer look at these efficiency statistics, let's evaluate how far above the field the Broncos and Seahawks really stand.
Payton Was Right to Decline

Here's the situation: At the beginning of the 3rd quarter against CAR, NO had a 1st and 10 at their own 16-yard line. They threw for a 7-yard gain, setting up a 2nd and 3 from their 23. But CAR was flagged for defensive holding, which would have given NO 5 yards and an automatic first down at their 21. NO head coach Sean Payton declined the penalty to the bafflement of many including the tv announcers.
The game did not hinge on this decision by any stretch. But it's worth taking a look at. The EP model is probably the right tool for the job in this case because it gives a much finer level of precision to down/distance/yd-line situations than the WP model or other approaches.
Using the hand-dandy WP calculator tool (which as a bonus is also an EP calculator), here are the relevant numbers:
Momentum 4: How Streaky Are NFL Games?
 This is the 4th part in my series on examining the concept of momentum in NFL games.The first part looked at whether teams that gained possession of the ball by momentum-swinging means went on to score more frequently than teams that gained possession by regular means. The second part of this series looked at whether teams that gained possession following momentous plays went on to win more often than we would otherwise expect. The third part focused on drive success following a turnover on downs, which is often cited by coaches and analysts as a reason not to go by the numbers when making strategic decisions.
This article will examine how 'streaky' NFL games tend to be. If momentum is real and it affects game outcomes, it would result in streaks of success and failure that are longer than we would expect by chance. But if consecutive plays are independent of previous success, the streaks of success and failure will tend to be no longer than expected by chance. This method of analysis does not rely on any particular definition of a precipitating momentum-swing, as it looks at entire games to measure whether success begets further success and whether failure leads to more failure.
For momentum to have a tangible effect on games, it does not require completely unbroken strings of successful or unsuccessful plays. But if success does enhance the chance of subsequent success, then the streaks of outcomes will be longer than if by chance alone.
For this analysis, I applied the Runs Test to the sequence of plays in a game. This produces a statistic indicating how streaky a string of results is compared to what would be expected by chance. For example, consider the following 3 strings of results of flipping a coin 8 times:
HTHTHTHT, HHHHTTTT, HTTTHTHH
The Runs Test works like this:
What Kind of Teams Are Super Bowl Winners?

Here's the plot of every team's regular season Expected Points Added (EPA) for every team from 1999-2013. The horizontal axis represents their offensive EPA per game, and the horizontal axis represents their defensive EPA per game. The best teams are in the upper-right quadrant, while the worst are in the lower-left. (Click to enlarge...it's suitable for framing!)
Sunday's Numbers Have Been Crunched
Advanced stat box scores
Top QBs of the week
Top RBs of the week
Top WRs of the week
Top TEs of the week
Top Defenders of the week
Advanced team stats
Offensive player season leaders
Defender season leaders
Team Viz
Position Leaders Viz
QB Viz
RB Viz
Seahawks Stumble, Should Have Allowed TD


Dome at Cold Revisited

A few years ago I looked at how dome teams tend to struggle in cold weather. I wanted to know if dome team underperformance in the cold was indeed true and if so how big was the effect. The answers were: Yes and huge. Last season I redid things using actual game temperatures and found just as big an effect.
With the weather as it is on the east coast today, I looked at this phenomenon once again. We have two more years worth of data thanks to the addition of 1999. Plus, I was able to reconstruct nearly another half season worth of data by replacing missing game temperatures from the gamebooks. I also broke out teams that played in retractable-roof stadiums by season.
Here are the results if we count retractable teams as dome teams. There's a case to be made that retractable home environments are closer to dome environments than open air stadiums. The chart below plots road team winning percentage according to game temperature.
Roundup 12/6/13

West coast teams have a big advantage in night games. I think I buy the numbers here. Backed by a solid theory.
Do nice players make their team worse? Perhaps a lesson for teams looking at Richie Incognito next season.
Stat leader rewind at PFR. I think football stats (the trivia kind anyway) need to be put in context of the era, especially compared to baseball. This will help.
Are football player lifespans shorter because of football or simply due to weight (or maybe other lurking factors)?
There are only 11 minutes of action in a 3 hour football game. And there are over 100 commercials.
Who are the best deep passers?
An article by Harvard's Nieman Journalism Lab on the brave new world of the 4th Down Bot. (It's a good thing I didn't show them this.)
I'd also like to take this opportunity to call out the call-out from that article: "The model and the bot are starting points for analysis. It's not meant to be the final arbiter of coaching decisions." I understand some of the negative reaction to Riverboat ROM (as podcast host Dave Collins nicknamed it). It's undeniable that in-game decisions aren't really as cut-and-dry as the Bot makes it seem. We tried to make that clear up front, in its introduction at NYT and here at ANS. Besides, we all have instant opinions for 4th downs when watching games as fans. It's not the worst thing in the world for those opinions to be informed by what the numbers suggest.
Sports Illustrated looks at last Saturday's big decisions in the Alabama-Auburn and Ohio State-Michigan games using (a modified) WP Calculator. For the record I disagree with the article's analysis of Alabama's long FG.
Saban's Hyperbola: Analyzing Alabama's Long FG Attempt

Let's look at the FG decision more closely. I won't use the WP model, but instead apply some math and logic. There were three options for Alabama:
1. Kneel
2. Hail Mary
3. Attempt the FG
Let's make some assumptions. First, OT is a 50/50 proposition. Alabama was favored in this game, but Auburn was playing strong. Plus, OT is a bit of a dice roll to begin with. Second, Hail Marys (Maries, Mary's?) from that range are probably no more successful in college than they are in the pros, which is around 5%. Lastly, for the sake of the argument, let's say there is zero chance of a defensive TD return on the Hail Mary.
We don't really know the probability of a successful FG attempt or the probability of a successful return or block & return from a range like that, especially in college ball from a kicker without many attempts. But let's set that aside for a moment.
Playoff Projections - Week 13
All of the numbers below come from Chris Cox at NFL-forecast.com. His app uses the win probabilities from the ANS team efficiency model to run a Monte Carlo simulation of the remaining NFL games thousands of times. Based on current records, our estimates of team strength, and knowledge of the NFL's tie breaking procedures we can come up with some pretty interesting predictions of how each team will fare come the end of the season. If you want to use a different model or just fiddle with the numbers by hand, go ahead and download the app yourself.
Week 13's biggest movers
With a little help, Miami was able to boost their playoff probability 29%. A victory over the Jets plus losses by the Steelers, Titans, and Chargers made the Dolphins the clear favorite for the AFC 6th slot.
Game Probabilities - Week 14
Game probabilities for week 14 are available at the New York Times. This week I look at the Kansas City Chief's unusual season.
...The efficiency model never thought the Chiefs were a dominant contender. At their peak after Week 7, they were ranked seventh over all. Since then, they’ve slipped to 22nd.
Admittedly, two of the Chiefs’ three losses came against a very good Broncos team, but the efficiency model accounts for opponent strength. In fact, despite being outplayed in their most recent loss, they rose one notch in the model’s efficiency rankings....
Win Probability Model/Calculator Upgrades - Team Strength Adjustment & More
I just implemented several new features and significant upgrades to the Win Probability Calculator tool as well as the model behind it.
1. The biggest new feature is the capability to adjust the WP estimates based on relative team strength. This is accomplished by entering either a pregame WP estimate from the efficiency model, another source, or the game's point spread. The model has had this ability for a long time, but I didn't want to implement it until I had a sound way of doing so.
The prior pregame estimate of WP is revised as the game goes on with the baseline in-game WP estimate. The two probabilities are reconciled using the logit method. The trick is to understand how the pregame difference in team strength decays over the course of the game. At a certain point, it doesn't matter how much a team was favored if it's trailing by two or more scores late in the game. Team strength differential decays proportionally to the log of time as the game progresses according to a particular curve.
Pregame WP or spreads should be with respect to the current offense. For example, if the game's spread was -3 but the visitor has the ball in the scenario you are investigating, enter 3 for the spread. In what is a cool enough feature all by itself, entering a spread will automatically convert into a pregame WP estimate.
For the record, the WPA stats for teams and players will continue to use the baseline unadjusted WP numbers. If we used the adjusted WP numbers, every team and player would have a zero WPA assuming our pregame estimates were accurate. Put simply, using the adjusted WPA stats would defeat their very purpose and only be a measure of how good our pregame forecasts were.
2. The next most significant update is the ability to account for receiving the kickoff in the 2nd half. This can have an effect of up to a 0.04 WP swing in the first half of close games. The input asks users for whether the team with possession kicked off to start the first half or not. This consideration doesn't apply following the 2nd half kickoff, so for 2nd half scenarios you can just leave the input at the default Don't Know.
Team Efficiency Rankings: Week 13

As you would expect, these types of teams are only fringe contenders, with far too many deficiencies to make a serious Super Bowl run. Of course, we could easily have said that about last season's champs, who look like the favorites to become this year's postseason party crashers.
Podcast Episode 11 - Pete Palmer
Dave interviews Pete Palmer, one of the original great minds in Sabermetrics. Pete co-authored The Hidden Game of Baseball, and later, The Hidden Game of Football. Pete describes how he discovered a scorekeeping error that incorrectly listed Ty Cobb's 1910 batting average as too high, thereby literally rewriting the baseball record books. He then discusses what it was like to edit baseball and football encyclopedias, how he made the move into football analytics and his current role as a member of the New England Patriots statistics team. Pete outlines the major findings he and his co-authors describe in The Hidden Game of Football, including early versions of expected points and win percentages. The show concludes with a discussion of questions he's interested in analyzing in today's NFL.
Subscribe on iTunes and Stitcher
Momentum Part 3: After Failed 4th Down Conversion Attempts

This installment cuts to the chase. From a strategic perspective, we want to understand how momentum may or may not affect the game so that coaches can make better decisions. Often, momentum is cited as a consideration to forgo strategically optimal choices for fear of losing the emotional and psychological edge thought to comprise momentum.
Here's the thinking: If a team tries to convert on 4th down but fails or unsuccessfully tries for a two-point conversion, it gives up the momentum to the other team. The implication is that failing on 4th down means that winning is now less probable than the resulting situation indicates, beyond what the numbers say. Therefore, the WP and Expected Points (EP) models used to estimate the values of the options no longer apply. In a nutshell, the analytic models underestimate the cost of failing.
[By the same token, the reverse argument should be just as valid. Wouldn't succeeding in a momentum-swinging play mean the chances of winning are even higher than the numbers indicate? For now, I'll set the 'upside' argument aside and examine only the 'downside' claim.]
New Feature: The NYT 4th Down Bot

In partnership with the New York Times, I'm pleased to unveil the bane of every football coach in America--The 4th Down Bot. At its heart, it is a real-time application of the 4th Down Calculator feature here at ANS. It uses both the Expected Points model and the Win Probability model to estimate the best option for every 4th down as a game is in progress.
Sunday's Numbers Have Been Crunched
Advanced stat box scores
Top QBs of the week
Top RBs of the week
Top WRs of the week
Top TEs of the week
Top Defenders of the week
Advanced team stats
Offensive player season leaders
Defender season leaders
Team Viz
Position Leaders Viz
QB Viz
RB Viz
Should You Kick a FG on 3rd Down?

Unless you're inside the 10 kicking on 3rd down isn't a good idea. Even a gain of 1 yd improves FG prob more than the chance of a bad snap.
— Brian Burke (@Adv_NFL_Stats) December 2, 2013
Admittedly, I wrote that just based on my familiarity with the relevant numbers, so I thought I'd do the legwork. FG% improves with every yard closer a team gets. Every yard matters. In fact, every yards matters to the tune of 1.6% per yard when the line of scrimmage is between the 35-yard line and the 10-yard line.
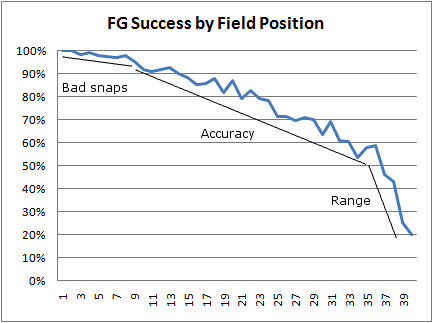
Yesterday, Keith looked at this kind of situation in the context of the CHI-MIN game, and his results suggest the same conclusion. This post will examine play outcomes on 3rd down when the game is on the line and teams are in deep FG (attempt) range, and compare them to the likelihood of a bad snap or hold.
Overtime Field Goal Gaffes Galore
 The Vikings ended up in overtime for the second consecutive week, this time against the Chicago Bears. After a quick Bears' three-and-out, the Vikings drove down field to the Bears 21-yard line. The game is now in sudden death format, so a field goal wins it. Unfortunately, in the NFL there is the myth of field goal range. The summation of that article is in bold at the bottom: "Closer is always better."
I first want to mention that field goal kicking has improved dramatically over the last few years, and the two kickers involved in this game (Robbie Gould and Blair Walsh) are among the very best in the league. The Vikings, facing a 3rd-and-10 from the Bears 21, opted to attempt a 39-yarder rather than try to get closer. For Blair Walsh, this is seen as a gimme. In today's NFL, that is about an 87% proposition. Very likely, although still more than a 1-in-10 chance he misses.