
NCAA basketball win probability site is up and running for a beta shakedown this weekend. The address is: wp.advancednflstats.com/bball. Right now I'm only running the top 25 games, but I can do all the games if anyone really wants them.
The NFL without a Salary Cap?
 The upcoming 2009 season could be the last year of the NFL salary cap. The current collective bargaining agreement expires following the 2010 season, but the agreement states that the final year of the agreement will not have a salary cap and there will be substantial limitations to free-agency. This might be the last year before the league returns to the pre-1994 days of dynasties, doormats, and mismatches.
What could we expect without a salary cap? In this article, I'll compare the 1978-1993 pre-salary cap NFL to the modern 1995-2008 league to get an idea of how things might change. Specifically, I'll compare parity levels from the era before the salary cap and after it.
When we're talking about parity, we're talking about at least two different ideas. This excellent series from PFR outlines the concepts as well as anywhere I've seen. The first kind of parity is within-season parity, meaning within any given year teams would be relatively close together in talent levels. There would be few teams with extreme records such as 15-1 or 2-14 and more teams with records close to .500. The second idea is year-to-year parity. This means teams would recover quickly from poor seasons while the teams at the top of the league would not stay on top very long. There would be fewer dynasties and fewer perennial doormats.
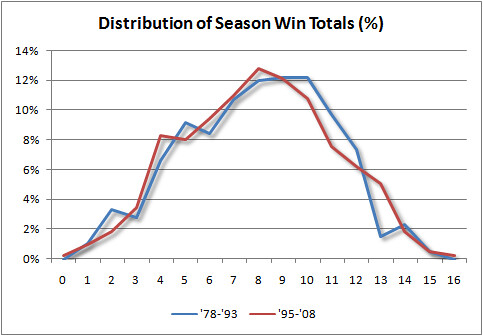
I'll look at within-season parity first. How does the pre-cap era compare with the current era in terms of relative team strength? Season win totals should be a good place to start. After all, winning is the bottom line. Below is a histogram (frequency plot) of team win totals for both eras. The pre-cap era is in blue and the current era is in red.
The wider and flatter the distribution, the less parity there would be. More within-season parity would produce fewer extreme win totals and more records close to .500, resulting in a taller narrower distribution. Here we see very little difference between the two eras. It would be impossible for anyone to distinguish the difference between eras just by looking at win totals. In fact, the standard deviation in win totals for the current era is nearly identical to that of the pre-cap era, (both at 3.0 wins).
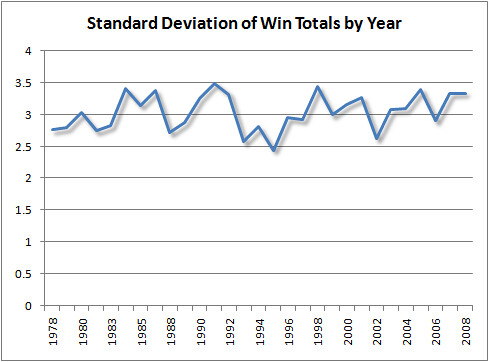
Here is another look at within-season parity. The next graph charts each season's standard deviation in wins(excluding the strike years of 1982 and 1987). When the cap was instituted in 1994, we'd expect to see some sort of effect.
But we really don't see any change. The salary cap doesn't appear to have had a detectable effect on within-season parity, at least in terms of team wins.
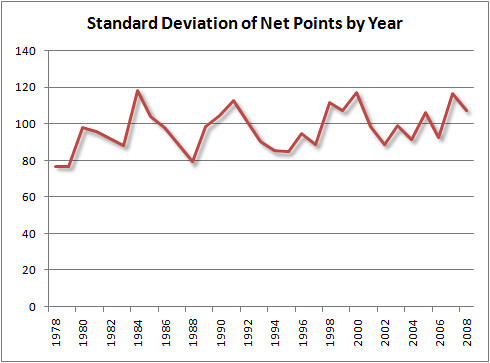
What about other measures? The next graph charts the standard deviation of team net point differentials. Net points (points scored minus points allowed) are known to be less random than win totals. If the cap had an effect on parity, we would see fewer blow outs, more close games, and accordingly smaller net point differences for each team.
Again, there doesn't appear to be an effect on within-season parity.
We can't necessarily conclude that the salary cap had absolutely no effect on within-season parity, but we can say that whatever effect it did have was not noticable in terms of the things that matter to fans--wins and competitiveness. So if the salary cap is not extended past 2009, we probably won't be able to notice a difference in 2010.
In the next post, I'll look at year-to-year parity. Has the salary cap helped poor teams improve quicker and made it harder for great teams to stay on top?
published on 2/25/2009
with
19
comments
Fighter Pilots and Firing Coaches
 At its heart, football strategy is game theory. But at the heart of game theory is utility theory--the science of defining and measuring what is useful. Utility in football is tricky. A 4 yard gain on 3rd and 5 isn't very helpful, but the same gain on 2nd and 4 is.
Utility theory is also at the heart of economics, which may be why we see some coaches with economics backgrounds do well. One of the cornerstones of utility is Prospect theory, a concept developed by researchers Daniel Kahneman and Amos Tversky. Simply stated, Prospect theory says that people are averse to losses more than they value equivalent gains. It was a major breakthrough, and it won the 2002 Nobel prize for economics.
But this article isn't about Prospect theory as much as it is about some of Kahneman's earliest work. While Tversky was always an economist, Kahneman's training was as a psychologist.
In the late 60s, Kahneman was a consultant for the Israeli Air Force. He lectured instructor pilots on the latest research that showed that reward was far more effective than punishment at improving performance. Instructor pilots were not buying any of it.
They told Kahneman, when student pilots have a bad flight we yell and scream at them, and the next day they tend to do better. But when they have a good flight we'll praise them like you suggest, and they tend to do worse.
It was then that Kahneman realized how natural variation in performance, and its natural regression to the mean, were fooling the flight instructors into believing it was their yelling and screaming that improved the student pilots' performance. Flight instructors saw this:student has poor flight --> yelling and screaming --> improvement on subsequent flight
When in reality, they were just as likely to see this:student has poor flight --> improvement on subsequent flight What does this have to do with firing coaches? Owners rarely fire coaches who just finished a successful season. A new coach comes in and there is usually an improvement, but that improvement would tend to happen anyway, with or without a new coach, simply due to regression to the mean.
For those who aren't familiar, regression to the mean is not metaphysical mumbo-jumbo. It just means that the change in performance from one day to the next is most often in the direction of the overall average performance (and not directly to the average itself, or to the average and no further). It occurs because when things go really bad it's usually because several bad things all happened at once to spoil the outcome. And when things go really well it's usually because several good factors conspired to win the day. It's not likely that all those factors will repeat in the same way.
Regression to the mean is not a rule, but it is a law. In other words, in some cases good outcomes get even better the next time, or sometimes bad outcomes get even worse. But the fact that most of the time good outcomes won't be as good and that bad outcomes won't stay as bad is an unalterable fact of life.
For example, when the 2008 Detroit Lions went 0-16, it was because they had injuries at critical positions, little talent on defense, a tough schedule, plus the ball never really bounced their way. Next year, it's unlikely that all those things will occur again, and they'll likely win a handful of games. And when the 2007 Patriots went 16-0, several factors all went their way. They had acquired lots of talent on both sides of the ball, had a relatively easy schedule, and stayed healthy all year. In 2008, they didn't stay healthy and mustered 5 fewer wins.
NFL owners and team executives, repeatedly witness this cycle:team does poorly --> fires coach --> team does better
And they are tricked into attributing the team's improvement to the firing of the coach. The result is a belief that replacing the coach is more helpful than it truly is. In reality, this is almost as likely to happen:team does poorly --> team does better
In fact, how do we know that starting over with a new coach doesn't hurt more often than it helps? Perhaps teams with new coaches improve slightly less than similar teams who keep their coaches. I'm not claiming that all coaches should keep their jobs no matter how poorly their team does. My point is that replacing the head coach is probably not nearly as effective a move as it appears.
The recent parity of team talent levels in the NFL has made the regression effect more prominent. Because teams are generally closer to each other in talent, it is much easier to go from few wins one year to many more the next (and vice versa). Only a slight improvement or decline is required to leverage a large change in a team's fortunes. This may be why the average coaching tenure is getting shorter.
This lesson should extend into all sports, and even day-to-day life. Beware of stories like these: "I had several bad colds last year, then I started taking [herbal product X], and now I don't get sick as often." Or, "My portfolio took a beating last quarter, so I changed my fund manager, and now my investments are making gains again." How about, "Our economy was in a slump, so we borrowed and spent $900 billion to cause it to recover." Or maybe, "My NFL franchise lost too many games last year, so I brought in Bill Parcells, and now it's doing much better."
published on 2/19/2009
with
21
comments
Reading List
 I've been accused many times by many different people of making things up. Friends, family, and coworkers have all raised the B.S. flag on me. My problem is that I remember things both too well and not enough. I'll remember the gist of an interesting magazine article from ten years ago, but the details will be hazy. Someone will say, "where did you get that?" And I'll say, "I don't know. I read it somewhere." "Yeah right," is usually the response.
One of the most common (and favorite) emails I get asks where I get my ideas. Many of them come from the random things I read, so I thought I'd share some of the most relevant books and articles. And with the off-season in full-swing you might have some extra time on your hands come Sundays. Below is my "I read it somewhere" list.
The Hidden Game of Football
Authors Caroll, Palmer, and Thorn were the first to bring innovative statistics on the NFL to the masses in this 1988 book. They explored topics included expected points, win probability, and a "win/fail" model of play success that is the basis of Football Outsiders' DVOA. I didn't read Hidden Game until the beginning of the most recent season, more than two years after beginning this hobby. I'm glad I did because I was able to develop my own original ideas, and the book is so insightful and original that I think it would have put me in a box.
The Wages of Wins
Before I started this site, I had recently read Freakonomics. I thought someone should write a Freakonomics but about sports. Wages comes pretty close. Written primarily by economist, basketball expert, and long suffering Lions fan Dave Berri, the book looks at all major American sports with a heavy dose of the NBA. The centerpiece is Berri's Wins Produced stat for basketball players.
Fooled by Randomness
This is one of my favorite books of all time. Nassim Taleb writes about the role of randomness in the world and our lives. He's part mathematician, part economist, part financial trader, and part philosopher. His prophetic warnings of how Wall Street's risk models were perilously overconfident were sadly unheeded. Fooled by Randomness was a big bestseller, and Taleb's follow-up The Black Swan was an even bigger hit.
Super Crunchers
The alternate title of this book was supposed to be The End of Intuition. 'Super Crunchers' and other titles were tested with quantitative methods before settling on the final name of the book. It's an overview of the many fields being influenced by advanced statistical methods. Airline prices, medical diagnoses, wine vintages, dating services, and even movie script formulas are all now the domain of econometric modeling.
Coincidences, Chaos, and All That Math Jazz
This is a fun, very non-technical book about a wide range of topics, including probabilities, uncertainty, chaos theory, cryptography, notions of infinity, and even aesthetic proportions. It's all interesting stuff, but I learned the most about chaos theory, and it influenced how I think about modeling and why predictions are so difficult.
The Drunkard's Walk
This book is very similar to Taleb's Fooled by Randomness but far less opinionated and with more of a historical bent. Don't read one or the other. Read both.
Games and Decisions: Introduction and Critical Survey
When groundbreaking thinker super-geniuses write books with titles that say "Introduction...," don't be fooled. This book is one of the milestones of game theory and it's highly technical. But if you really want to understand the inner workings of game theory, dig in. I had to read each chapter two or three times before I could understand most of it.
Game Theory: A Nontechnical Introduction
This is the book I wish I had read before Games and Decisions. It is the most interesting 272 pages I've ever read. The implications of game theory relate to so many topics--relationships, economics, psychology, business, diplomacy, war, and even evolution. It's clear, complete, quick, and fascinating. No calculus, I promise.
Moneyball
Michael Lewis' smash-hit book on baseball sabermetrics. This is much better than his attempt at football--The Blindside. Soon to be a movie starring Brad Pitt (I'm not kidding).
Freakonomics
This book has little to do with sports, unless you count sumo wrestling. A runaway bestseller a couple years ago, it's about applying econometric math to things other than economics. A few years before the book was published, I was using logistic regression to predict which midshipmen at the Naval Academy were most likely to violate its honor code. That's how I first learned all this stuff.
Non-books
An Introduction to Utility Theory
This is the best explanation of the concepts of utility theory I've found. It's a survey of all the basic research and ideas of utility theory. It's chock full of great stuff.
GameTheory.net
Want to take courses in game theory from the top universities in the world? You've hit the mother lode. Lecture notes and lots of other great resources are available here. My favorite is this class.
Romer's 4th Down Paper
A groundbreaking application of quantitative football analysis. My summary if it here.
Anthology of Statistics in Sports
This is a compendium of hard-core academic research in sports. The studies cover a wide variety of sports, including football. To be honest, some of it is over my head. But I like stretching my mind, and I learn a lot from studies like these, not just about the subject at hand but about good methodologies too.
If you have any suggestions, please add them in the comments below.
published on 2/16/2009
with
14
comments
Searching for an Optimum Interception Rate
 Toward the end of last season, I theorized that a team could be throwing too few interceptions. Watching the Redskins' struggles in the second half of the 2008 season, I wrote:
"I think head coach Jim Zorn or quarterback Jason Campbell became captive to the idea that they were winning because they weren't throwing interceptions. While a lack of turnovers certainly helps win games, if it becomes a passer's primary goal it could be harmful.
Interceptions are a part of the bargain, a natural consequence to throwing the ball. You can guarantee zero interceptions by playing in an extremely conservative way, tossing short passes, taking sacks, or throwing the ball away anytime a defender is in the same zip code as the receiver. You can minimize interceptions, but you'll lose every game doing it.
At some point in the risk-reward continuum, there is an optimum level of risk in passing strategy."
Very simply stated, if a QB tries to throw zero interceptions, he'll end up being too cautious and score fewer points than if he were more aggressive.
If my theory is right, we might be able to see it in the stats. The problem is, how do we measure risk? Interceptions could occur because a good QB is aggressive or because a bad QB is, well, bad. Recently, Doug Drinen made very similar observations. But unlike me, he actually attempted to find evidence of the 'optimum turnover rate' theory.
Doug proposed that we measure turnover risk level by turnovers per non-scoring drive (TOs/NSD). This is very clever because it helps resolve the issue of whether turnovers come from aggressiveness (think Mike Martz) or suckiness (think Rex Grossman). If we just looked at turnovers per drive, we'd see low-risk but low-scoring/low-talent teams with higher numbers of interceptions per drive.
By looking at turnovers this way, Doug found a small increase in points scored the higher a team's turnovers per non-scoring drive. This is evidence that a higher-risk strategy will result in more interceptions...but even more points scored.
I thought I'd look at it in a slightly different way. First, I think interceptions, more than total turnovers, are far more a function of aggressiveness and risk. Fumbles seem more random to me, or at least not a function of a team's aggressiveness. I also want to use some different methodology that might reveal an optimum turnover or interception rate.
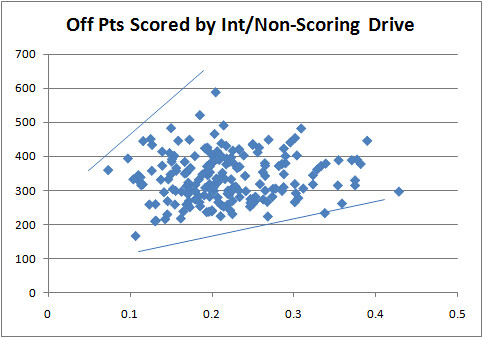
Unfortunately, the data isn't clear enough to plot a curve with a clear maximum, but I did find some interesting results. First, take a look at the graph below. It plots offensive points by interceptions per non-scoring drive. You can see a clear relationship--more interceptions translates into more scores.
The correlation coefficient is 0.08, which is non-significant. If you add in fumbles, the correlation is 0.05, which suggests fumbles are indeed more random. This is consistent with what Doug found--a slight but positive connection between risk-taking and points scored. It's far from conclusive, however.
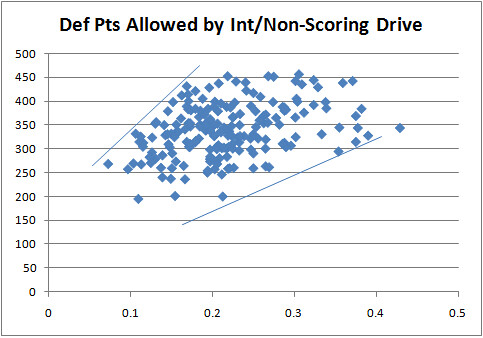
We haven't looked at the other side of the coin yet. What about points-allowed? Do teams with higher INTs/NSD drive allow more points?
Yes, they do--by a lot. The correlation is 0.37, strongly significant and about four times as strong a correlation as with points scored. So although there is some evidence that the more aggressive an offense is the more points it can score, the points allowed by all those additional interceptions are far more consequential. But correlations assume linearity, and that might not be the case.
Look at the first graphs again. Look at where the offensive points scored maxes out--around 500 points at 0.2 INTs/NSD. And the defensive points graph also tops out at about 0.2. To me, this says that there is little benefit from exceeding 0.2 INTs/NSD. While we can't say that 0.2 is the optimum, we can say that it is the maximum possible efficient rate. Lower may still be better, but above 0.2, you're in trouble.
published on 2/10/2009
with
10
comments
Weekly Roundup 2/7/09
 With the cold, dark void of the off-season upon us, I think the next few roundups will be more monthly than weekly. But for now, here's the last edition from a great 2008 season.
A hot topic leading up to the Super Bowl was Kurt Warner's Hall of Fame prospects. There seemed to be two camps: he's already in, and he needs one more ring to get in. I'll leave my own opinion out of the discussion except for one point. The "he needs one more ring" argument is almost completely irrational. Kurt Warner, last time I checked, doesn't play defense. He led three teams to Super Bowls and (except for a few final seconds of desperation) he never walked off the field with his team behind. At age 37 he torched the best pass defense of the decade for 377 yards and 8.4 yds per attempt.
I'd buy arguments like he's benefited disproportionately from exceptional receivers, or hasn't had a long enough career, but to rest the decision on a defense allowing an 88-yard drive or Adam Vinatieri making a field goal is almost nuts. I say almost because as Tom Tango points out, it's the Hall of Fame and not the Hall of Merit.
I'd like to do 'similarity scores' like the baseball guys do, particularly for players like Warner. We could compare who he's most similar to, and see if those comparable players are Hall of Famers. PFRs "Approximate Value" ratings are probably the closest thing. I'd like to know Warner's career AV and compare it to those of other HoF-type players.
JKL of PFR made a compelling case for Derrick Thomas who was selected last week. I wasn't familiar with his life story, and I'm now pleased he made it because I'm partial to sons of fighter pilots (even one who doesn't eat all his vegetables or finish his math homework, or one who beats me in fantasy football!)
Smart Football breaks down the one play Warner most wishes he had back.
Cold Hard Football Facts ranks the top Super Bowl drives of all time. I agree that the Giants' game winning drive from last year tops the Steelers'. Anything but a TD would have meant doom for New York. Tyree's catch was simply one of kind. Plus, Giants had the underdog thing going for them.
The Numbers Guy looks at championships per capita and points us to the "Donovan Index." Pittsburgh ranks among the top cities.
Orlando Sentinel columnist Mike Bianchi asks if Pat Tillman is worthy of the Hall of Fame. I'd go a step further and turn the question around. Is the football Hall of Fame worthy of men like Pat Tillman? When you think of it like that, it illustrates the pure silliness of the Hall of Fame and professional sports in general. (Silly, but fun.) The term we use when someone is named to the Hall is enshrined. Isn't that a little much? Are these people martyred saints or something?
I think it would be a fitting tribute, even if Tillman's football career does not merit selection, his decision to give up the NFL does. And we're not talking about merit, but fame--right?
Does the fact that friendly fire caused his death instead of an enemy bullet change your perception at all? I hope not. Most people do not understand what friendly fire is all about. Combat by its nature is extremely confusing and uncertain. The modern US military can be so effective, so incredibly lethal, that its greatest danger is sometimes itself. Friendly fire is an unfortunate byproduct of uncertainty and lethality in war by highly trained but imperfect humans.
Tillman gave up a privileged life and answered the call of his country in a time of need. That alone is something to revere. And regardless of who fired the bullet with his name on it, he died honorably defending you and me. In a time of athlete-worship, Tillman stands out.
Those too-serious "G" commercials from Gatorade, with the sports stars panning across the screen, begin by saying, "It's the emblem of a warrior." Well, no it isn't. There isn't a single warrior in that ad (except perhaps Jackie Robinson who was drafted into the Army for a year). Those players between the goal lines who we call heroes are not courageous warriors. They are highly paid gifted athletes. It does not take much courage to face a charging 240 lb linebacker at all...if you're a 220 lb running back...being paid a million dollars. And it's not so courageous to play with a sprained MCL if it's your shot at personal glory, and it's probably to the detriment of your team.
So I'd say of course Pat Tillman deserves to be in the Hall, if only because his story puts everything else in perspective.
published on 2/07/2009
with
4
comments
The Off-Season
 During the NFL off-season, fans are treated to the countless and predictable stories of contract hold outs, mini-camp no-shows, and draft hype. But for number crunchers like me, the off-season is when we can do our best work. Without the weekly grind of game predictions, team rankings, playoff forecasts and play-calling analyses, I can focus on more meaningful projects.
Last year I was able to do some deeper research. I took a look at the run/pass balance question in depth. My series on the passing paradox put to rest a lot of the questions surrounding why most teams appear to run too often. Based on those articles, I also developed a way to measure coaching risk aversion.
The randomness of turnovers was another focus of my off-season research. I was able to predict the apparent struggles of the San Diego defense and refine my game prediction model.
The final nail was put into the coffin of the myth of running back overuse. The connection between the Wonderlic Test and QB performance was also thoroughly debunked.
During the annual soap opera, I showed how overrated Brett Favre really is, and that a lot of his apparent success has come not from his own skill, but from his receivers. The Jets learned the hard way just how true that is.
The draft analysis by position was, I think, both straightforward and useful. We learned there aren't a lot of 6th round Hall of Famer QBs to be had, and that the best RBs come from the top rounds just like any other position.
By far, the most interesting subject to me was game theory. I gobbled up books on it all summer. It's fascinating stuff, and its lessons go far beyond sports. My game theory articles have actually become part of lessons in some university classes. I frequently get bunches of clicks from college 'blackboard' sites.
I also got my hands on a play-by-play database, which opened up a broad array of possibilities for research. I examined the three primary measures of utility in football: first down probability, expected points, and win probability. I was also able to construct an in-game win probability model that became the basis of the funky graphs I made all season.
There are lots of interesting articles buried in the archives here, so please click around when you get the time. I realize most people would call this site a blog and expect near-daily postings, but I cringe whenever it's referred to that way. I'm not throwing out my personal opinions on topics of the day like the vast majority of blogs out there. But the blog model is very convenient for publishing.
So this off-season, what can you expect?
Optimum turnover rates--should some teams throw riskier passes to increase their chances of winning, even at the expense of more interceptions? Are some teams too timid?
How consistent are team statistics during the season? Another year of data answers a lot of questions. You'll see that 2008 was the year of consistency in defensive interceptions. There are significant ramifications for the ranking and prediction models.
I'm working on major improvements to the in-game win probability model. The model will be primarily based on LOWESS (locally weighted regression/noise reduction) techniques. I'll also go back through the 2000 season and can build WP graphs for any game. I'll be able to do some other neat stuff, such as find out 'what was the dumbest 4th down decision of the decade?'
I've also been working on a fantasy projection system. Like my other efforts, it will be simple and open, and I'm confident it will be at least as accurate as any other out there. Plus, more positions will be added to my draft analysis. I'll also put together an 'Advanced NFL Stats' reading list featuring all the great books that have helped inspire some of the research I've done over the past couple years. And those are just the things I'm working on right now, so stay tuned.
Just 184 days until the Hall of Fame game...
published on 2/05/2009
with
16
comments
A Pick-Six?
 It’s been two days and the shock waves from James Harrison’s unbelievable 100-yard interception return for a touchdown are still reverberating. Commentators usually refer to that kind of play as a “pick-six” because of the six instant points for the defense’s cause. But Harrison’s play was no pick-six. It was more of a pick-thirteen.
Having possession of the ball at various field positions is worth a certain average number of points. For example, having the ball with a first down on the 50-yard line is worth an average of +2 expected points for the offense. This means that, on balance, the next score is going to be by the team on offense, and the net of all the “next scores” favors them by 2 points.
The average field position in the NFL is actually midfield. So when a QB throws a pick-six, he’s giving up more than 7 points to his opponents. He’s also forfeiting the +2 point advantage he had. On average, an interception return for a touchdown is about a 9-point swing.
Harrison’s return in the Super Bowl however, came on a first down and goal from the 1. There, the expected points for the Cardinals offense was +6.1 points. The return was effectively a swing of 7 points for the touchdown, plus 6 expected points denied to the Cardinals. It was the Super Bowl’s first pick-thirteen.
Further, the value of the touchdown was even higher than most scores. Because time expired during the play, the Steelers did not need to kick off to the Cardinals, giving them possession and an opportunity to answer and score themselves. Normally, receiving a kickoff is worth +0.6 points, the value of having the ball at your own 27 with time enough to mount a drive. So the value of the play could be considered even higher.
published on 2/03/2009
with
8
comments
Incredible
 Two weeks ago I proclaimed Pittsburgh safety Troy Polamalu's interception return for a touchdown as the "play of the year." That single play snuffed out Baltimore's 45% chance of coming from behind to win a spot in the Super Bowl. Purely in terms of altering a team's chance of winning the championship, that play was easily the play of the year...until Sunday night.
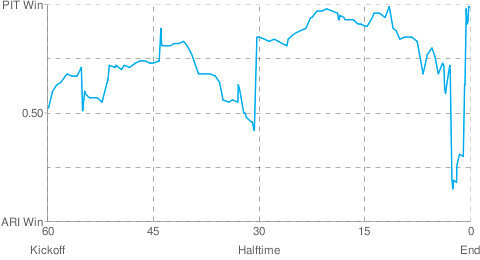
Super Bowl XLIII featured three separate plays of dramatic importance, each more consequential than Polamalu's interception.
(Click here for the same graph with play-by-play descriptions. Hover the cursor over the graph.)
The first play occurred just before halftime. Down by 3 with 18 seconds left in the half, the Cardinals had a 1st and goal from the 1. With at least a tie guaranteed, the Cardinals likely had three tries at a touchdown and a 4 point lead. Instead, Steeler LB James Harrison picked off a pass and returned it 100 yards for a touchdown to end the half. This was at least a 10-point swing in the score, and possibly a 14-point swing. The Steelers' win probability (WP) went from 0.41 to 0.85, a change of 0.44.
The second play was actually the biggest in terms of WP. Down by 4 with 2:53 left in the 4th quarter, the Cardinals faced a 2nd and 10 from their own 36. Cardinal's QB Kurt Warner hit WR Larry Fitzgerald for a 64-yard TD to take the lead 23-20. This play took Arizona's WP from 0.30 to 0.80, a jump of 0.50. Unfortunately, the play was by the losing team, so it will be lost to obscurity as soon as Sunday night's Sports Center highlights end.
Despite being the most spectacular, the third play was not quite as decisive in terms of WP. With 35 seconds left in the game, Pittsburgh WR Santonio Holmes made an impossible 6-yard TD catch. Pittsburgh's WP went from 0.63 to 0.98, a difference of 0.35. But that doesn't count the play that put the Steelers on the 6 yard line and in position to score. Holmes' 40-yard reception two plays earlier swung Pittsburgh's WP from 0.30 to 0.60. In total, the entire scoring drive took the WP from a low point of 0.15 following the Steelers' 10-yard holding penalty to start the drive, to 0.98 after the go-ahead TD.
published on 2/02/2009
with
22
comments
Subscribe to:
Posts (Atom)