

Unless you're inside the 10 kicking on 3rd down isn't a good idea. Even a gain of 1 yd improves FG prob more than the chance of a bad snap.
— Brian Burke (@Adv_NFL_Stats) December 2, 2013
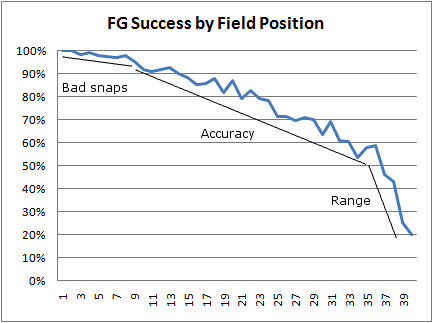
Admittedly, I wrote that just based on my familiarity with the relevant numbers, so I thought I'd do the legwork. FG% improves with every yard closer a team gets. Every yard matters. In fact, every yards matters to the tune of 1.6% per yard when the line of scrimmage is between the 35-yard line and the 10-yard line.
Yesterday, Keith looked at this kind of situation in the context of the CHI-MIN game, and his results suggest the same conclusion. This post will examine play outcomes on 3rd down when the game is on the line and teams are in deep FG (attempt) range, and compare them to the likelihood of a bad snap or hold.
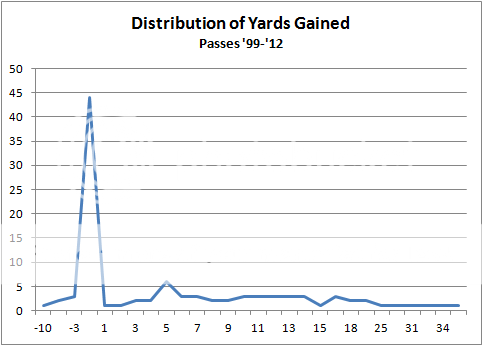
Run plays average 4.3 yards, and pass plays average 6.3 when a team is down by 0 through 3 points in the final 3 minutes of a game and their field position is between the 35 and 25. (Those seem long to me, too--but the averages are 3.8 for runs and 4.6 for pass plays in situations under 1 minute to play.) But averages aren't everything--here are the distributions:

We also need to consider turnovers, which would typically be fatal or near-fatal. But there's not much to consider. In the last 13 seasons, there has never been a fumble lost on a 3rd down prior to a make-or-break long FG attempt, and there have only been 3 interceptions. Those 3 interceptions have come on 173 pass plays, for a 1.7% rate. Offenses are wisely protecting the ball.
A back-of-the-envelope analysis says that a run on 3rd down, which averages 4.3 yards improve the chance of making the FG by 4.3 yds * 1.6% = 6.8%. A pass on 3rd down improves the chance of making a FG by 6.3 yds * 1.6 = 9.9%. But when we consider the cost of a turnover, the benefit is cut by, say, about 2%. Ultimately, we'd be safe saying that the benefit of running a conventional scrimmage play on 3rd down improves the chances of winning by at least a net of 4%+.
What about bad snaps and holds? Unfortunately those aren't official league statistics. So how can we estimate their likelihoods? Well, extra points don't get any easier as a matter of a kicking exercise, so let's proffer that every single missed XP is the result of a bad snap or hold. Even if we do that, does the risk of a bad snap/hold outweigh the benefit of the potential yardage gain?
XPs were successful on 99.5% of all attempts in 2012 and 99.7% so far in 2013. The numbers for FGs inside the 29 are just as high. Someone with game-charted play-by-play might have a better number, but I'm confident bad snaps and bobbles occur in fewer than 1 in 200 FG attempts, or 0.5%.
Even with the most conservative of assumptions, a conventional play on 3rd down, on average, improves the chances of winning by at least 8 times greater than the risk of a bad snap or hold.
Inside the 10 yard line, things change
But what about the value of peace of mind to the snapper and holder, as @dmv726 pointed out on Twitter? I don't think there's much to that, based on what I've learned over the years. It's equally likely players focus even more is such situations. But the real evidence is that FG attempts are no less successful in clutch situations, so it's extremely unlikely snaps and holds are adversely affected by pressure. Run
Run a play on 3rd down and gain some yards. "Field goal range" is a myth. Closer is better, and the risks aren't big enough to make the difference.


"...fewer than 1 in 200 FG attempts, or 0.05%."
That would be 0.5%. --Alessio
Corrected-thx.
interesting article, but this also highlights one of my pet peeves of "analytics". After stating and showing that the average gain per rush is not really meaningful, this article then goes ahead and uses it to show a 6.8% (rushing) increase in win chance, and a 9.9% chance (passing), adds in a handwaving -2%, and makes a firm conclusion.
first, Has no one ever written SIG DIG on your tests? is 6.8% really statistically different than 6.9%?
second, why use the mean after showing the problem with using the mean. a coach would probably use the most common result (1 yard gain) while looking at the chance of a bad play (what percent of the rushes are less than 1 yard?)
third, nfl wide averages are meaningless. you can run against the jaguars, you should not run against the lions.
fourth, i'd say one should put a +-20% on all game win probabilities. Look at any GWP of any game as it occurs. it goes between 80% to 20% about every 5 minutes. in fact, that spread should probably be +-50%. :) that was a joke.
The average length gained on those run and pass plays is based off a very right skew distribution. A better statistic to use to estimate the "usual" gain would be like the median or mode. The two distributions you show bring this to light.
So if you want to run it on 3rd down, you'll probably end up gaining a yard, which you contend makes it 1.6% more likely that they'll make a FG.
However, to correctly assess the value of the 3rd down FG, you need to take the expected rate of success. Meaning (where FGP is the FG percentage at a given spot):
If you rush it on 3rd and kick it on 4th:
[FGP + .016].995
If you attempt the FG on 3rd, bobble it, and then attempt it again on 4th:
[FGP].995 + [FGP - 10*.016].005
(assuming that you hold it ~10 yds back from the line of scrimmage)
So the two are the same at FGP = 3.3440 - so you shouldn't go for it on 3rd.
We can certainly relax some of the constants there and play around with the numbers. Say for instance we think that the probability of a bobbled snap is 2.5%. Then the two situations are equal when FGP = 78.4%, which looks to be ~20 yd mark on your first chart.
I think I remember that when we looked at two point conversions, we discovered that some two point conversions are actually botched snap/holds on extra points. The holder drops the ball and then has no choice other than to get up and run. The official stats mark this down as a failed two point conversion not a failed extra point.
Is this true or is my mind playing with my memory? If this is true the numbers for real two point conversions are better than you think and real PAT attempts are worse.
Jeff Clarke, you are correct.
I wonder what the stats say for a fake field goal on 3rd down. Now that would be unexpected
Peterson's winner with 7:46 remaining in overtime came one play after Alvin McKinley blocked his 24-yard attempt, the second Browns kick block of the day. But because it was only second down and Pittsburgh's John Fiala fell on the bouncing football -- which never crossed the line of scrimmage -- the Steelers (1-2) retained possession. Peterson redeemed himself on the next play.
"Coach (Bill) Cowher asked if I wanted him to run a play so I could get my bearings back,'' Peterson said. "I said, no, it's a 31-yarder, I can make that, so let's kick it and go home.''
Steelers 16 Browns 13. Sept 29, 2002.
Kicking on second down surely is unusual.
JMM, the Vikings even kicked their winning field goal in overtime yesterday on first down.
This question should really be settled by using EP to weight the run/pass success distributions. This takes into account the improved accuracy of FG's, the occasional plunge into the line that becomes a TD run, the cost of turnovers, and even the bobble/muffed snap.
Use the right tool for the job.
Will, that would usually be true but EP won't account for end-of-game scenarios like this.
Yup, median would be another good way to look at this, and the results would still strongly favor running a play. That's one of the reasons I prefer to see the distributions and not rely on strict averages. Making those charts takes a few minutes but it's well worth it.
Regarding the rant above about 6.8% and 6.9% and whether they are significantly different in a statistical sense: Worrying about whether p=.04 or .08 completely misses the point of the exercise. This isn't an academic setting where we have the luxury to retreat into statistical agnosticism about the null hypothesis. *The coach has to make a decision one way or the other.* Even if the p-value were 0.49, without some other overriding consideration you'd still want to go where the evidence points, right? [More on this in a full article soon.]
The 6.8 vs 6.9 strawman isn't even relevant. The relevant question is whether the improved chance of winning by running a play is greater than its risk of losing. Lastly, you may have noticed that the distributions report the actual count of each outcome, not just a % of the total. There are >150 runs and >150 passes in the data--plenty for reliable estimates, so I'll worry about p-values when I flesh this out for my dissertation.
Jeff-That's a good point. I think even if we counted all of such plays, including intentional fakes as bobbled or bad snaps, we'd get the same result, but it's worth checking.
JMM-Nice find!
*The coach has to make a decision one way or the other.*
That does not mean one should give them falsely precise numbers. Nor does it mean that league wide past results should be used (for anything other than a rough guideline, perhaps to point out huge differences in outcomes - but the coaches already know that).
"The relevant question is whether the improved chance of winning by running a play is greater than its risk of losing."
exactly. but nfl coaches do not get an infinite number of tries at that play, so they can't bring in the analysis team to show that they did make the "right" decision. It wise to be risk averse, because when you have a highly probable game winning FG opportunity but you throw an interception on 3rd down, it will get you fired, even if you can show you had a few percent better chance of winning.
There is one thing I left out is 'aborted plays'--bad snaps/handoffs/etc on 2nd or 3rd down plays. They are rare, and there is a significant turnover risk as a result. But there was only 1 such relevant play I could find--Philip Rivers lost fumble snap vs KC--the infamous "worst play ever." That would push things in favor of an early FG, but not nearly enough to make a difference.
Suppose there is a clay jar with 100 marbles in it. Some of the marbles are red and some are green. I'll give you $1,000 if you predict which color marble you pull out of the jar. And I'll punt your dog off the Coronado Bridge if you predict incorrectly.
But first, I'll let you draw 10 marbles, and you can count how many of that sample are red and how many are green. (We'll replace them and shake up the jar for a full 100.)
Let's say you pull out 3 red and 7 green. After replacing those marbles, which color are you going to predict?
Tick Tock! You're out of timeouts!
Ummmmmm. Ummmm. But the p value that the proportion of red and green is significantly different from .50 is only 0.23, you say.
The lesson here is that you can't worry about p-values and standard errors. You would have to be a fool to say red. You have no choice but to go with the evidence you have and make the best decision with the information at hand.
Awesome post. Regarding whether more detailed play-by-play could make the estimates more precise, Football Outsiders does appear to accurately record causes for failed kick play attempts and to properly distinguish between true conversion attempts and botched kick plays that turn into conversion attempts.
Conclusion: In 2012, the snap or hold prevented an intended kick on .3% of plays where teams wanted to kick an XP or FG.
More thorough explanation with specific numbers and other related ideas below, for the hardcore ANS comment readers:
Teams intended* to kick an XP 1240 times.
*The traditional XP% formula only counts the play if the ball was kicked. Blocked kicks count as failures, while aborted plays (where the snap/hold prevent a kick) are simply not counted. That’s why P-F-R says 1235 attempts, but FO says 1240. Since we’re trying to determine the frequency of completely botched snaps/holds, 1240 is the number we want.
1229 good
2 outright misses
4 blocked
5 aborted
Teams intended to kick a FG 1017 times
852 good
143 outright miss
21 blocked
1 aborted
(Blocks are more common on FGAs than XPAs, presumably overwhelmingly due to lower trajectories being needed on longer kicks. The difference in aborted play frequency must be random variation. I checked that deliberate fake kick plays were not counted as aborted attempts.)
So on the 2257 XP/FG plays with an intention of kicking the ball, 6 were aborted. (All 6 times, the kicking teams picked up the ball on these plays, which means they’d be able to try another kick from further back on the next play. No blocked FGs were recovered by the offense, and blocked kick recovery is not allowed on XP attempts.)
At 6/2257, a completely a botched snap/hold occurred on .3% of these plays.
Also of note with the 2013 data is that the new defensive formation rules may make blocks the slightest, slightest bit rarer.
And last, if your FG Success by Field Position graph indeed used the traditional Kick Success Percentage formula (for all I know you already accounted for the limitations of P-F-R’s formula with respect to what we care about), botched snaps and holds wouldn’t be a factor, but blocks could be the dominating factor at the low end.
These calculations also assume correct execution of the bobble handling. The holder could easily panic and do something stupid.