

In a nutshell, the system estimates the probability one opponent should beat another. If an opponent wins more often than expected, his rating would improve, and vice versa. The algorithm needs to start with a prior expectation of how good each player (or team) is. Then, as the players complete matches, their ratings are adjusted upwards or downwards based on who won. The size of each adjustment is based on how significant the win was. For example, if a grand master chess player beats a novice, his rating would hardly budge, but if a novice beat the master, both ratings would move significantly.
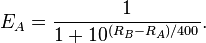
The actual algorithm is based on the function below. EA is the expected win probability of player A. RA is player A's rating, and RB is player B's rating.
After a game between opponents A and B, player A's new ranking (R'A) is revised as: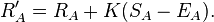
For example, if player A's rating is 1655 and player B's rating is 1500, then according to Elo's function the probability A would beat B is 0.65. If player A defeats player B, then the actual outcome is 1.00. Player A's new rating would be:
R'A = 1655 + 32 * (1.00 - 0.65) = 1666
One interesting way to look at the ratings is to create a generic win probability. By using the Elo algorithm to compute the expected win probability against a notional average rating, we can get a sense of each team's expected winning percentage.
Sagarin's Application of Elo
Jeff Sagarin uses a version of the Elo system to create NFL team ratings. He transforms them to produce ratings that are predictive of a game's point spread. So the difference between two opponents' ratings, plus an adjustment for home field advantage, predict the margin of victory. Sagarin's adjustment is a straightforward linear transformation of the original Elo system, as you can tell from the graph below. (I suspect Sagarin may over-weight recent games, however.)

Elo Mimicked
Using the same method as I described in my last post, we can mimic Elo ratings. That method computed team ratings based on margin of victory from each game. Instead of using margin of victory we can simply replace the score of each game with a 1 or 0 based on who won. Then we can solve for the ratings that best estimate the game outcomes. Because the ratings are linear we can transform them into individual game probabilities or generic win probabilities using a logistic transformation:

These rating systems can be adapted for any type of game or sport. Recently, on-line games have been using similar algorithms to rank players. The primary advantage to this type of system is that it discounts victories over very weak opponents. Often players will set up phony opponents to beat in order to inflate their own scores.
To get a sense of what these rankings would look like for the most recent (2007) NFL season, the table below lists several ratings for each team. The Elo column lists the ratings I derived from the actual Elo algorithm. The Sagarin column lists Jeff Sagarin's version of Elo--his final 2007 season ratings . Lastly, based on the Elo algorithm, the win probability column lists the probability each team would beat a league-average team on a neutral site. All ratings include results from the playoffs and Super Bowl.
| Team | Elo | Sagarin | Win Prob |
 NE NE | 2315 | 36.2 | 0.99 |
 DAL DAL | 1913 | 29.89 | 0.92 |
 NYG NYG | 1877 | 32.35 | 0.90 |
 GB GB | 1865 | 28.97 | 0.89 |
 SD SD | 1836 | 28.46 | 0.87 |
 IND IND | 1807 | 27.23 | 0.85 |
 JAX JAX | 1692 | 25.62 | 0.75 |
 WAS WAS | 1656 | 23.44 | 0.71 |
 PHI PHI | 1624 | 23.63 | 0.67 |
 TEN TEN | 1573 | 22.63 | 0.60 |
 DET DET | 1553 | 21.47 | 0.58 |
 MIN MIN | 1523 | 22.22 | 0.53 |
 HOU HOU | 1523 | 20.25 | 0.53 |
 TB TB | 1512 | 19.82 | 0.52 |
 DEN DEN | 1490 | 19.82 | 0.49 |
 CHI CHI | 1480 | 21.61 | 0.47 |
 CAR CAR | 1453 | 17.93 | 0.43 |
 SEA SEA | 1440 | 20.43 | 0.41 |
 PIT PIT | 1438 | 18.64 | 0.41 |
 NO NO | 1429 | 17.42 | 0.40 |
 CLE CLE | 1413 | 18.71 | 0.38 |
 BUF BUF | 1384 | 18.24 | 0.34 |
 ARI ARI | 1374 | 16.45 | 0.33 |
 OAK OAK | 1309 | 14.34 | 0.25 |
 CIN CIN | 1284 | 14.83 | 0.22 |
 ATL ATL | 1262 | 13.34 | 0.20 |
 KC KC | 1254 | 14.71 | 0.20 |
 BAL BAL | 1240 | 12.56 | 0.18 |
 SF SF | 1231 | 12.49 | 0.18 |
 NYJ NYJ | 1198 | 11.98 | 0.15 |
 STL STL | 1103 | 9.54 | 0.09 |
 MIA MIA | 946 | 4.8 | 0.04 |


Interesting ... the probabilities in the last table look a bit extreme. Does Sagarin really believe that the Patriots are 99-1 favorites against an average team?
"Belief" doesn't play into it, it's what the formula says.
Have you figured out his secret formula for his "overall" rating, the synthesis between Elo and Pure Points?
Phil-Probably not, but strictly in terms of win/loss they were 18-1. Their only loss was to the #2 ranked team.
Justin-I tried to figure it out. It's not an average of the two, nor a weighted average. It's slightly and non-uniformly biased toward the margin of victory system, especially at the extremes of very good and very bad teams.
"Often players will set up phony opponents to beat in order to inflate their own scores."
As a former tournament chess player I can report that in the chess world at least the problem practice is the opposite. Players "sandbag" to deflate their ratings to be artificially low, so they can enter the lower-rated sections of tournaments and have a better chance of winning the prize fund.
The Elo system can be used to measure the outcome of virtually any kind of ongoing, repeated competition.
E.g.: It's been used to rank univerisities on the basis of which one a student chooses to attend when accpeted by two of them. http://www.nber.org/papers/w10803
This was actually pretty interesting, because many of the rankings were very different from those published by US News and such, meaning students value things rather differently than the "rankers" do.
Using the 4-digit Elo scale of the chess world, with a 200-pt gap meaning the higher-rated wins about 75% of the time, the top and bottom schools of the 105 rated were, if anybody wonders ...
1. Harvard 2800
2. Yale 2738
3. Stanford 2694
4. Cal Tech 2632
5. MIT 2624
.............
101. Purdue 1525
102. Colorado State 1513
103. Syracuse 1506
104. Scripps 1479
105. Loyola 1221
But there's a problem with applying the Elo system to the NFL, I think. To have a reliable, accurate, stable rating for a team you need the outcomes from more games than there are in a season. When I was a chess player (which admittedly was a while back) IIRC one needed the results from 24 to 40 games to get a real rating (depending on the flavor of the system and the purpose it was used for), until then a rating got an asterick* as being provisional = unreliable, dubious.
I haven't looked at applying the system to the NFL per se, but I don't see why this problem would go away.
JG-Very interesting about the college rankings, but I'm too cheap to lay out the 5 bucks for the paper.
By the way, I didn't mean to impugn chess players when I mentioned inflation. I was referring to the kids who play Halo on their XBox all day.
JG brings up a very interesting point, since the NFL ratings can hardly be said to have converged after a mere 16 games per team. There is likely still some sensitivity to the initial ranking (which I presume was all 1500?). The Pats, for example, are getting big credit for their early wins over their division rivals before we found out how terrible that division was from 2-4. What happens if you re-run the season using the given rankings as the initial? Or last year's rank?
Sandbagging chess players impugn themselves. As to Halo and Xbox, you'll know you've reached a certain age when after spending your entire life explaining the latest electronic stuff to others they start explaining it to you.
My point about the number of games needed for a reliable Elo rating is for predictive purposes. Looking backward, if one wants a strength-of-opposition weighted ranking of what a team *actually did*, Elo does that just fine. Nobody can argue with it.
Predictively, however, for what a team is expected to do in the future, I believe there are too few games in the NFL season for the Elo system to show its stuff (at least until the very end of the season). That's from my memory of how the system works, which is old, maybe Sagarin or somebody has since then pushed the system's bounds, I dunno. But if that's not so I'd certainly prefer a Pythagorean or some other method for making predictions in the mid-NFL season.
If I'm right about the predictive limits with this number of games it may relate to the Pats 99% win rating. That's a good measure of how they actually performed last year objectively, 18 wins and a loss to the #3 team, but if they could magically replay last season I'd really hesitate before predicting a 99% win performance for them again, as good as they were.
Footnote: I have a copy of the college ranking paper, it doesn't have anything to do with sports but if you actually are interested the price would be right. Also, Elo himself wrote a book about his system and its ranking system predecessors and their problems. It doesn't have anything to do with sports either, but history-wise it's interesting -- today's "post-Bill James everybody has a PC and their own rating system on it" world is very different from back when people were building systems from first principles using pen, paper and mechanical calculators. The book is long out of print but probably would be in a good library. FWIW.
I think it was on this site, or maybe Sabermetrics, but somewhere I saw a statistics paper cited that in the NFL, teams are sufficiently "sorted" after 10 games. There are fewer NFL teams than there are chess players, therefore fewer games would be needed.
I would think that Elo would still be a decent measure of ranking after 10 games. The % chances it puts on winning may not be accurate until many more games, however. The world may never know.
Interesting. I have been using a modified ELO ranking for the last 3 years in my office pool with great success (~70% accuracy), although I am considering using a different approach this year.
JTapp
"somewhere I saw a statistics paper cited that in the NFL, teams are sufficiently "sorted" after 10 games"
is that 10 games or 10 weeks of games?