
 For most guys, fantasy football drafts bring to mind pitchers of beer and pizza. While I love both those things, I also think about...logarithms. Although I don't focus on fantasy football here, it's hard not to write about NFL statistics without at least one or two fantasy articles each season. Hopefully, this will satisfy some of the email requests I get this time of year.
I play in my office's league each year, but I'm not one of those guys that does lots of research or pays a website for their recommendations. But this year I decided to put some thought into how to have the best draft. Two primary questions came to mind.
First, how consistent are the various elite players at each position? In other words, how reliably do last year's stars repeat as elite players this season? For example, are QBs more consistent than RBs? The more reliably consistent a position is, the more certain we are to get value from spending a high pick on it. Second, how large is the drop-off in performance at various positions? For example, how does the scarcity of good RBs compare to that of WRs? The scarcer the position, the earlier it should be drafted.
Using data from the past five NFL seasons, I'll quantify both the consistency and scarcity of each position, then combine both concepts to make recommendations about fantasy draft strategy.
Consistency and scarcity are the two most important considerations when choosing a player, particularly in the first several rounds. Overall total value is nearly totally meaningless, which means picking the "best available player" is far from the best strategy. I'll illustrate why. And unfortunately, yes. It has to do with logarithms.
Scarcity
Imagine a 5-team league in which the scoring rules project the top 5 QBs to score 400, 395, 380, 375, and 370 points. The top 5 RBs are projected to score 300, 250, 200, 150, and 100 points. Who would you choose with the first pick? The best available player strategy dictates you take the #1 QB, projected to produce 400 points. Your second round pick would likely be the #5 RB at 100 pts, giving you a 2-round total of 500 projected points.
But by considering scarcity, you'd see that the drop-off among RBs is far steeper. Chosing the #1 RB with 300 pts, and the #5 QB with 396 pts, yields a total of 670 projected points. This is an exaggerated hypothetical, but it exemplifies the fallacy of choosing the best player. What really matters is the difference between the top available player and the expected next best available player at each position. That difference is what should dictate your selection.
In the example above, the difference between the top QB available (400) and the next best expected QB available (365) is 30 points. The difference between the top RB available (300) and next best expected RB available (100) is 200. Looking at it terms of next-best-available, the RB is the obvious choice.
Consistency
Let's say that we're deciding between taking a RB and a WR in the 3rd round. Assume the scarcity differences happen to be equal for both positions. Our best expectation is that 4 RBs and 4 WRs will go off the board between our 3rd round pick and 4th round pick. The best available RB is projected to produce 100 pts and the next expected available RB is projected to produce 50, for a difference of 50. The WRs available have the same exact values. How should we decide?
What if top RBs reliably repeated their performance from year to year at an 80% level of consistency, but WRs were up and down from year to year, keeping on average only 60% of their performance levels? We should bank on the RB in the 3rd round, and save the gamble on a WR for a later round.
But, if year-to-year WR performance is highly variable, doesn't that mean they could improve too? Sure, but there's not a lot of room for improvement at the top. Players with the very top performances in one year are far, far more likely to decline, even if slightly, than to improve. Plus, if there is indeed a lot of upside potential in WRs, why not wait until a later round to start grabbing them?
A lot of this might seem obvious to some people, and it's why the typical draft pattern goes RB-RB-QB-WR-WR... So why not quantify these concepts and see if fantasy football conventions hold up?
Quarterbacks QB is a relatively consistent position. The year-to-year correlation in fantasy points for the top 32 QBs the past 5 seasons is 0.60. This means that if we want the best guess as to how many fantasy points to expect, we would use 60% of their difference from the average. So if the average QB gets 100 points in a season, and the QB we're thinking about drafting got 160 last year, for 2008 we should expect:
Regression to the mean gives us our best statistical estimate. It accounts for injuries, natural improvements or declines, change in teammates, change in opponents--everything. We can say QBs are about 60% consistent.
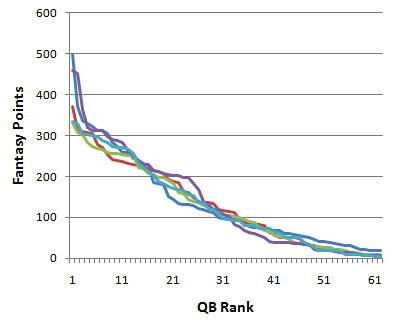
QBs are relatively scarce too. After the top 1 or 2 guys, there is a steep fall-off in performance illustrated by the graph below. (Each line is for one of the past five seasons. 'Rank' refers to actual performance, not order in which players were drafted.) Unless you get one of those top guys, you can wait to pick up a QB in your draft, which is what typically happens each year.
Fantasy leagues differ in size, but a typical one may have about 10 or 12 teams. One good measure of scarcity would be the difference in fantasy points between the top tier of the best 10 QBs and the 2nd tier of 10 QBs. I chose tiers of 10 because in a typical league, if you pass up taking a QB in the current round, you can expect that the 10th next-best QB will be available for your next pick, even in a worst-case scenario. For QBs, the difference between the 1st tier and 2nd tier, is 87 pts. The difference between the 2nd and 3rd tiers is 76.4 pts.
Running Backs Everyone knows how precious solid RBs are in fantasy football. At least that's the conventional wisdom. Typically you need to start two of them, and between byes and injuries, you really need three starter-quality backs.
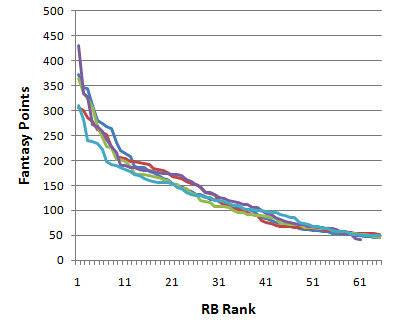
RBs are not quite as consistent from year to year as QBs, tending to retain about 48% of their previous year performance. RBs drop-off curves are not quite as steep as for the QBs, and then levels off a little quicker as evidenced in the graph below.
First tier RBs outperform 2nd tier RBs by 64 points, and the 2nd tier outperforms the 3rd tier by 31.
Wide Receivers WRs are, by far, the least consistent position, retaining only 16% of performance levels from year to year for the top 32 receivers. But because there are typically 2 primary starting WRs on each team, I also ran the correlations for the top 64 WRs each year, which would. Still, they retained only 34% of their prior year performance using this method. Either way, WR performance is the least predictable of the primary offensive positions.
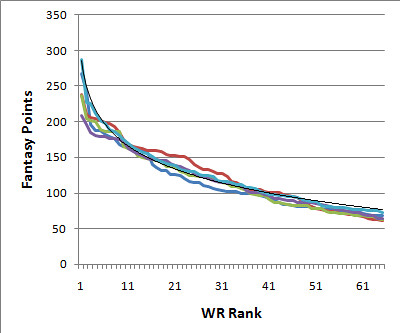
WRs are not nearly as scarce as QBs and RBs. The drop-off after the very best receivers is not as steep, and there is an abundance of mid-tier WRs deeper into the ranks.
The difference between the 1st tier WRs and the 2nd tier is 55 pts, and the difference between the 2nd and 3rd tiers is 25 pts. The differences are less than those for both QBs and RBs.
Tight Ends TE tends to be something of an afterthought in fantasy drafts. Most guys will pick up 2 RBs, a QB, and 2 or 3 WRs before grabbing a TE. They can be overlooked because as a group they don't score many fantasy points in absolute terms. But I think that's a mistake.
TEs are remarkably consistent compared to WRs. In fact, they tend to be the most consistent of all the fantasy positions. They retain 63% of their previous year's performance. The drop-off is also relatively steep.
In part 2 of this article, I'll tie together the scarcity and consistency at each position. I'll then outline a strategy that will give you a big advantage in your league's draft.
Notes:
1. Players who retired or suffered season-ending injuries in the pre-season were not included in the analysis. They would not have been in the draft, and so do not count against the consistency and scarcity measures.
2. Fantasy points were calculated using 6 pts per TD, 1 pt per 10 yds rushing, 1 pt per 25 yds passing, and -2 pts per turnover.
3. Data is from PFR and Yahoo.
Fantasy Draft Strategy
100 + (160-100)*0.60 = 136 pts
published on 8/17/2008


Subscribe to:
Post Comments (Atom)
Are you eschewing replacment-level theory here? It's by far the most important way to take account of scarcity. Players should only get credit for points they'll produce above the likely last picked player at their position. That's why the best kicker is worthless even though he scores 150ish points.
Also, is consistency really that important if you've properly regressed a player's projected point total?
Since regression to the mean is the norm for NFL teams (ie: overall record), then wouldn't drafting players on teams that should regress from below .500 while avoiding players on teams teams due to regress from above .500 last year be a good strategy? There seems to be so much randomness in individual performance, given random injuries and such.
Did you look at the correlations by player or by ex post rankings?
Sky-No. I think replacement-level is a good and useful concept. What I'll eventually get to is a specific version of replacement level. What is *your* replacement level at *this point* in a draft. Because everyone in the end is forced to have the same position-based lineup, the focus should be on maximizing the drop-off between your picks and everyone else's.
Omar-by player. Basically, I want to how consistently do elite players repeat the next year.
Sky-On your second point, you're right. That's exactly what regressing does. It accounts for the consistency levels.
You are also on the money about kickers. I'm not trumpeting that I've discovered something entirely new, just quantifying what most people intuitively understand already. People seem to get VORP when drafting kickers, but look at absolute scoring when picking TEs.
Good stuff. Basically what you spoke about correlates to AVT Theory which is what good managers rely on early in drafts. The key is projecting the right guys to the numbers. That is where the difficulty lie. In the end, known commodities should be taken in the very early stages with upside guys later