
 In his 2007 paper Home Advantage in the NBA as a Game-Long Process, Marshall Jones found that home court advantage in the NBA is not consistent throughout a game. Instead, it's disproportionately realized in the 1st quarter. The home advantage diminishes in the 2nd and 3rd quarters, then is smallest in the 4th quarter. He also found that when home teams enter a quarter behind, they tend to substantially outscore their visiting opposition. So how about in the NFL?
In the NFL, home teams also enjoy an advantage, although not as large as in the NBA. HFA is commonly thought of as about 3 points or so, and home teams win 57% of regular season games.
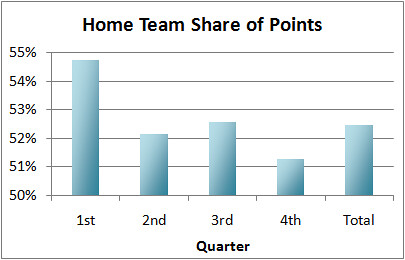
Below is the breakdown by quarter of the home team's share of points.
Overall, home teams score 52.5% of all points through the entire game. By far the largest advantage is seen in the 1st quarter, when home teams score 54.7% of the points scored during that period. The 2nd and 3rd quarters see a significant drop off, followed by the 4th quarter which shows the smallest advantage.
So just like the NBA, HFA in the NFL is primarily realized in the 1st quarter. Now let's compare how home teams fare when behind or ahead.
When trailing, home teams show the same pattern as the overall share in the 1st graph. But when ahead, home teams show no pattern, scoring about 59% of the points in each quarter. So there is a difference in the HFA effect not only by quarter, but by score difference as well.
Note that although trailing home teams score fewer than half of all points, this is what we'd expect. A team that's behind is likely the weaker team, so we would not necessarily expect them to outscore opponents, whether at home or not. This would not mean there is a home field disadvantage.
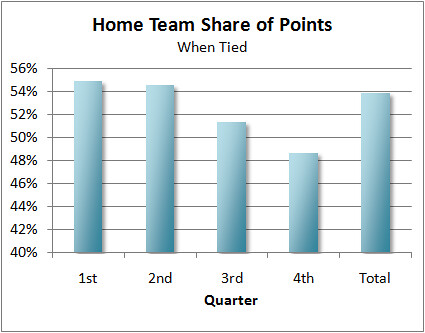
With that in mind, we can just look at points scored when the game is tied to (partially, at least) account for bias due to team strength.
Again, we see HFA diminish through the game. In fact, home teams score only 49% of points in the 4th quarter. My guess is that home teams that are tied in the fourth quarter have enjoyed 3 quarters of HFA, so they would tend to be the slightly weaker team without HFA. And since HFA becomes weakest in the 4th quarter, we're still seeing some bias due to team strength. In other words, it's better to be good than to be at home, especially in the 4th quarter. This is more than just random trivia. Understanding how strong HFA is throughout the game helps us understand where HFA comes from. For example, as Marshall points out in his paper, it was commonly thought that HFA comes mostly from the crowd. It was expected therefore, that HFA would be strongest in the 4th quarter when crowds are typically loudest and most involved in the game, especially when the score is close. Also, if travel fatigue is the cause, then we'd expect HFA to be strongest toward the end of the game when fatigue becomes most important. But we see that the opposite is the case, so HFA may come from somewhere else.
I think there are probably multiple processes involved. There could be game-long effects, such as the crowd, but then there could be another process that diminishes as the game progresses. But whatever the underlying causes, HFA is strongest at the beginning of the game and diminishes as the clock winds down.
Home Field Advantage by Quarter

published on 9/29/2008


Subscribe to:
Post Comments (Atom)
A model that incorporates game states would help disentagle the factors. I'm thinking primarily of situations where the home team has acquired a big lead early, and is content to sit on that lead through the rest of the game. A regression model like
% of pts scored by home team ~ home team lead + quarter
Other factors could be included on the right hand side. I know you've already thought of this, I'm just talking to myself out loud.
This is very interesting. As a statistician myself, and coming from Europe I did a similar study on Soccer, another game where HFA is supposed to be big. Given that in soccer you have 2 halves only, but you can record when a goal was scored, I divided each 45 mins half into 3 15 minutes thirds, ending up with 6 "Sixths" to analyze.
I am still working out the final details but early results seem to indicate that HFA is at its strongest during the 4th Sixth, that is the first 15 minutes of the second half...
Soccer. I think I've heard of that. That's the sport that European men and American girls play, right?
Just kidding!
@Rigil
Have you posted any of your stuff online anywhere? I am a basketball guy myself, but I love reading about stats work done in other sports.
Rigil-Actually, you sparked my memory. If I recall there was some safety issue in Italy a couple years ago that forced the soccer league there to play a bunch of games without any spectators. At the time I thought it would be a great HFA experiment--no crowd, no jet lag, very little travel--provided the sample was large enough. I wonder if anyone has looked at those games.
Nanker:
I haven't yet as I am still finalising all details...I hope to finish it off shortly...
Brian:
I haven't read or found anything about that,but I fear the sample may not big enough... in Italy you have an average 3-4 games per year with no spectators...
But it would be interesting to look into it.
I've really enjoyed browsing through your site -- very interesting. This is a bit off topic, but relates to scores per quarter. In the typical single game (Monday night, Superbowl, etc.) office football pool (10x10 grid of randomly selected digit combinations, with payouts each quarter for the square matching the last digits of the teams' scores) what are the six or seven most commonly winning digits? Short of answering this yourself, could you point me to a web reference for a couple of seasons' scores by quarter to do the analysis myself? I'm thinking the most common digits are 0,7,4,3, but I'm working on a pool for a smaller group and I'd like to know which digits to use. Thanks!
Dave
Anon-thanks. Glad you like the site. I haven't done the analysis myself, but it's been done many times. I'd google 'super bowl squares' and look for anything from Doug Drinen. If I recall, I think he did an analysis recently.
Thanks Brian
I just read a couple more articles on your site. You're a whiz! I'll surely be back. Thanks for the tip.
Dave
Judging by these results, my theory is that home field advantage comes from being used to playing in a stadium. For instance, home qb's are used to the colour of the crowd's jerseys and pick out their receivers better, home kickers are more familiar with footing etc. As the game goes on, the away players start to get used to the conditions and the advantage the home team has diminishes.
As NFL home field advantage is quite small, it might be interesting to see what parts of the game are unaffected by it. Also, it might be interesting to see whether away teams perform better in divisional games than in inter-conference games as, for instance, the Eagles play more games in Washington than they do in Oakland, therefore (according to my theory) would be more used to Washington's stadium than Oakland's.
I play rugby myself and even in our crowdless amateur leagues there is a large home field advantage, which seems to come from a subconscious understanding of the ideosyncrasies of the pitch.
Me too, i am from europe. I know soccer coaches away from home tend to play more conservative...
Translate to Football: Home team more aggresiv > early lead > away team behind > away team gets more agressiv while home team gets more conservativ ("sitting on lead")...
Result: HFA only in 1st Qtr. Just see the obvious, while not getting confused by the numbers.
To illustrate that more: Y/Run is even, while Y/PP is a high advantage by home team.
I guess all that high Y/PP advantage comes in the agressiv 1st Qtr.
Conclusion: Away teams should be more aggresiv (both in soccer and football) then the HFA disapears
What you are missing in this analysis is the WP affecting the home crowd. In the first quarter of every game, the crowd is always into it. The score starts out 0-0 and almost always is within 14 points in the first quarter, meaning the home team has their home crowd advantage.
Later in games (specifically the 4th quarter) the home team could be up or down 31-13, making the Win Probability too high or too low for the crowd to be "into the game".
The further into the game, the more likely it is that the individual play won't matter towards the outcome of the game. Not to have that interpreted as plays later in the game are less important. I am saying that the percentage chance of the play having an outcome on the games winner is less, not how big of a difference that individual play will make.
My theory is that if the crowd is into the game, it doesn't matter "how into it" they are. When they are really cheering hard in the first quarter, the difference of cheering in the 4th quarter isn't much greater and does not have an effect.
I would suggest you look at the percentage of points the home team scores when their win probability is between 35% and 65%. I believe that regardless of the quarter, the home field advantage is greater when it is a close game, rather than a blowout either way.