
 Toward the end of last season, I theorized that a team could be throwing too few interceptions. Watching the Redskins' struggles in the second half of the 2008 season, I wrote:
"I think head coach Jim Zorn or quarterback Jason Campbell became captive to the idea that they were winning because they weren't throwing interceptions. While a lack of turnovers certainly helps win games, if it becomes a passer's primary goal it could be harmful.
Interceptions are a part of the bargain, a natural consequence to throwing the ball. You can guarantee zero interceptions by playing in an extremely conservative way, tossing short passes, taking sacks, or throwing the ball away anytime a defender is in the same zip code as the receiver. You can minimize interceptions, but you'll lose every game doing it.
At some point in the risk-reward continuum, there is an optimum level of risk in passing strategy."
Very simply stated, if a QB tries to throw zero interceptions, he'll end up being too cautious and score fewer points than if he were more aggressive.
If my theory is right, we might be able to see it in the stats. The problem is, how do we measure risk? Interceptions could occur because a good QB is aggressive or because a bad QB is, well, bad. Recently, Doug Drinen made very similar observations. But unlike me, he actually attempted to find evidence of the 'optimum turnover rate' theory.
Doug proposed that we measure turnover risk level by turnovers per non-scoring drive (TOs/NSD). This is very clever because it helps resolve the issue of whether turnovers come from aggressiveness (think Mike Martz) or suckiness (think Rex Grossman). If we just looked at turnovers per drive, we'd see low-risk but low-scoring/low-talent teams with higher numbers of interceptions per drive.
By looking at turnovers this way, Doug found a small increase in points scored the higher a team's turnovers per non-scoring drive. This is evidence that a higher-risk strategy will result in more interceptions...but even more points scored.
I thought I'd look at it in a slightly different way. First, I think interceptions, more than total turnovers, are far more a function of aggressiveness and risk. Fumbles seem more random to me, or at least not a function of a team's aggressiveness. I also want to use some different methodology that might reveal an optimum turnover or interception rate.
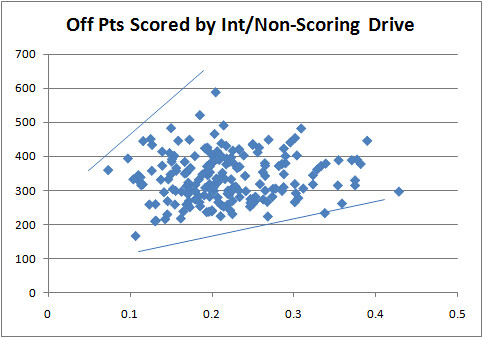
Unfortunately, the data isn't clear enough to plot a curve with a clear maximum, but I did find some interesting results. First, take a look at the graph below. It plots offensive points by interceptions per non-scoring drive. You can see a clear relationship--more interceptions translates into more scores.
The correlation coefficient is 0.08, which is non-significant. If you add in fumbles, the correlation is 0.05, which suggests fumbles are indeed more random. This is consistent with what Doug found--a slight but positive connection between risk-taking and points scored. It's far from conclusive, however.
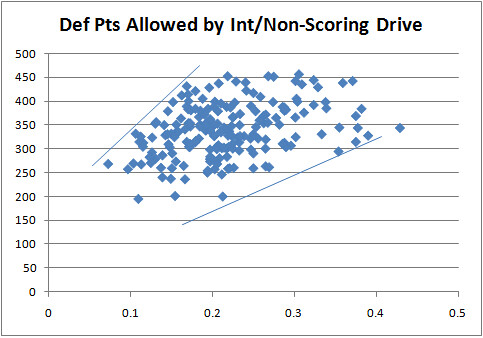
We haven't looked at the other side of the coin yet. What about points-allowed? Do teams with higher INTs/NSD drive allow more points?
Yes, they do--by a lot. The correlation is 0.37, strongly significant and about four times as strong a correlation as with points scored. So although there is some evidence that the more aggressive an offense is the more points it can score, the points allowed by all those additional interceptions are far more consequential. But correlations assume linearity, and that might not be the case.
Look at the first graphs again. Look at where the offensive points scored maxes out--around 500 points at 0.2 INTs/NSD. And the defensive points graph also tops out at about 0.2. To me, this says that there is little benefit from exceeding 0.2 INTs/NSD. While we can't say that 0.2 is the optimum, we can say that it is the maximum possible efficient rate. Lower may still be better, but above 0.2, you're in trouble.
Searching for an Optimum Interception Rate
published on 2/10/2009


Subscribe to:
Post Comments (Atom)
a ratio of punts to INT might be worth looking into
It would be nice to see where each team falls.
Both good ideas. I forgot to mention--data is from all teams 2002-2007 regular seasons (n=192).
(OFF TOPIC but kinda related)
While I accept the conclusion that turnovers are bad and are correlated to losing, there is a part of me that thinks; "teams alternate possession of the ball. Why should it matter if it is a fumble, interception, punt or on downs? Field position is the only true impact." Recently when these thoughts begin, I think of James Harrison.
This leads me to the idea of a delta probability involved with a change of possession. If the JH 100 yd gallop was delta 13 pts and more importantly a change in the win probability. Then can't we look at all changes in possession in a similar way? An intercepted Hail Mary at game end might yield a delta of 0.
If we knew the importance of a change in possession to winning probability, then we can make a judgement on when and which incremental passes are justified?
Let's say a team has a very good defense, which hold the opposition to many short drives whether by preventing first downs or getting turnovers. This team will get more offensive possession per game, and per season. Assuming they play average on offense (in every way) they they should ahve more points and more interceptions than average. Perhpas the correlation between interceptions and points is just reflecting the incr. number of possessions?
JMM
I agree. I can't think of the amount of times I've seen defenders intercept third and long passes inside their 5 yard line and then celebrate like they've just scored a touchdown. In terms of field position they'd be far better off tapping it down and taking the result of the punt.
As the stats show, more often than not the team that's just been intercepted will be the next team to score.
Back onto the main article, it is an interesting question. Certainly there is reason to believe a 'Laffer curve' like effect with regards to risk-reward. Not enough risk and you won't score points, too much risk and you won't either.
The question of 'how do we measure risk?' is the important part. If we can accurately measure offensive risk, we should be easily able to determine an optimum risk level.
This could eat up a lot of your offseason research time.
One problem is that every team will be making a different trade-off on risk-reward. One way of checking it will be to see if when placed in a position where more risk is called for, such as being 10 points down (and controlling for the quality of the opponent), we see better outcomes and not just riskier outcomes.
Brad Childress's and Jim Zorn's offenses are perfect examples for this sort of study.
...good offensive teams and bad offensive teams turn the ball over on roughly the same percentage of their non-scoring possessions.
In other words, the difference between Rex Grossman or Tavaris Jackson vs. Kurt Warner or Jason Campbell is that the good QBs produce more scoring drives (which never include turnovers or points). Thanks, but that much was obvious to me before. Why ignore the primary area of difference, though? I would have thought these articles more worthy of my time had I learned how much more often non-Grossmans/TJs succeeded compared to the Grossmans and other underachievers and what sorts of plays generated TOs for various teams. (Maybe a "safe", but predictable, 6-yard quick pass was not so safe after all, given the possibilities for deflections and fumbles in traffic?)
NSDs which don't end in a TO or punt are ended by the clock (which happens to all teams) or going for it on 4th down (usually because the team is behind). Taking those factors into account may have shown that the better teams do, in fact, commit fewer turnovers overall and on NSDs.
To really evaluate risk vs. reward in passing, one would need to account for the quality and frequency of the running game and for the defense. A QB with a running game and D of certain threshholds can afford to throw more risky passes. I think the types of passes attempted would be important, too. 3% INT's on passes of 10 yards or less would be atrocious, but perhaps not so bad on attempts of 40+ yds.
I would rather have learned if Jason Campbell had performed at or above the league average on scoring drives or not than something which tried to blame him for being too good.