
 In its simplest form, play calling in football is a game of two strategy choices--pass or run. Game theory teaches us that the mix between the two strategies needs to be unpredictable to be effective. Ideally, there should be an optimum ratio of running and passing based on the expected benefits and risks in any given situation. In this post, I'll examine the effect of predictability by comparing passing success when passes are most and least predictable.
In reality there are several different variations of runs and passes an offense can choose. And defenses don't have discrete strategy choices at all. They can select from a continuous range of strategy bias from run certainty to pass certainty. But for now, I'll limit my discussion to just the two most basic options.
Refresher
Consider the graph below from an earlier post on game theory in football. The horizontal axis of the graph represents a range of strategy choices for an offense. On the left is "always run," and on the right is "always pass." Between each extreme is a range of mixed strategies. Halfway between would be a balanced 50/50 run-pass mix.
The colored lines represent the utility to the offense of each of its strategy mixes when the defense chooses each of its own strategies. In this example, if the offense were to always run (left edge of the chart) and the defense always played a pass defense(red), the offense would be very successful. And if the defense always played run defense (blue), the offense would certainly suffer.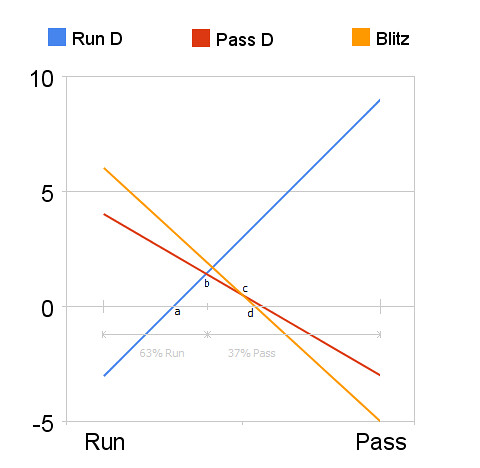
Keep in mind that yards do not equate with utility. Utility in football is ultimately win probability. The outcome of every play either increases or decreases a team's chances of winning. There are other considerations beyond yardage gained. For example, a 3 yard gain on 2nd and 2 may be better (higher utility) than a 4 yard gain on 2nd and 6. The risk of a turnover also has to be considered. But again, the analysis is always dependent on the situation and always assumes unpredictability. The benefit of the optimum strategy mix is lost if an offense repeatedly calls run-run-pass all game.
The Goal
What I really want to do is replace that example graph with a real one, based on real numbers. That might be something very useful. We could know truly optimum play calling mixes, or how to capitalize on opponent non-optimization. In a way, we could solve the 'game within a game' of play calling.
This is a Quixotic task, I realize. In fact, it sounds quite kooky. But we could narrow the focus enough and eventually begin to get some idea of what the utility graph looks like in certain situations. What we'd really need to do is nail down some of the critical values in the graph, such the endpoints of the utility lines at 100% run or 100% pass, or where the equilibrium point is.
Analysis
I decided to look at "10 yards to go" situations--1st and 10, 2nd and 10, and 3rd and 10 plays. When is passing least predictable? On 1st down. When is it most predictable? On 3rd and long.
All the numbers that follow are from all 10-yards-to-go scrimmage plays in the first 3 quarters of regular season games from 2000-2007. The only other limitation was that the game score was within 10 points. I wanted to exclude situations when teams exercised an abundance of either risk or caution.
Note the percentage of play types called on 1st, 2nd, and 3rd downs (with 10 yards to go). There is a fairly even split between run and pass calls on 1st and 2nd downs. On 3rd and 10, the a pass is far more expected.Type 1st 2nd 3rd Total Pass 47.2 52.7 91.1 49.6 Run 52.8 47.3 8.9 50.4
Although 91.1% isn't 100%, it's close to where the anchor point on the lower right side of the game theory graph--almost the pure pass vs. pass defense strategy combination. Now let's look at the average outcomes for these situations.Type 1st 2nd 3rd Total Pass 7.0 6.3 6.5 6.9 Run 4.2 4.4 6.9 4.3 Total 5.5 5.4 6.5 5.6
When passing is most predictable, it yields half a yard less than on first down, when it is less expected. Conversely, running is most successful when it is least expected.
At this point, I should point out that passing on 3rd and 10 yields slightly more yards than on 2nd and 10, which isn't completely what we'd expect. This is almost certainly because defenses will allow short complete passes on 3rd down in exchange for being relatively assured to be able to stop the gain short of 10 yards. This is part of the problem posed by the fact that yards does not equal utility. We'll have to dig a little deeper. The next table lists interception rate by down.1st 2nd 3rd Total Int Rate 2.6 2.9 3.5 2.7
Now we see more what we'd expect--a slight increase from 1st to 2nd down, then a large jump on 3rd down, in accordance with the associated increases in passing predictability. The next table lists adjusted yards per attempt, which is YPA with a -45 yd adjustment for every interception thrown. Adj YPA, however, still exhibits the same problem as plain YPA. It underestimates the drop off from 1st to 3rd down in passing effectiveness because defenses will allow gains, as long as they're not more than 9 yards.Type 1st 2nd 3rd Total Pass 5.9 5.0 4.9 5.6 Run 4.2 4.4 6.9 4.3
So what we can say is, the reduction in passing effectiveness due to predictability is likely at least 1 full adjusted yard per attempt. The drop from 1st down to 2nd was 0.9 yards, so the true reduction in effectiveness from 1st to 3rd down may be far larger.
Except that there's a problem with this analysis. There's a bias in the data. Which teams are more likely to face a lot of 2nd and 10s and 3rd and 10s? The ones that stink at passing. So the 2nd and 3rd down numbers are lower than would be representative of the league as a whole. In other words, poor passing teams 'get more votes' in the analysis.
Fortunately, I think I've solved this problem. I'll explain it in the second part of this article.
Passing Predictability Part 1
% of Play Types by Down, 10 Yds To Go
Yds Per Attempt by Down, 10 Yds To Go
Interception % by Down, 10 Yds To Go
Adj Yds Per Attempt by Down, 10 Yds To Go
published on 3/24/2009


Subscribe to:
Post Comments (Atom)
Brian,
Interesting, and I'll definitely be back to read the next installment, but I submit that the offense's choice between running and passing is a false dichotomy propagated largely by under-informed television sports analysts. The effect on the defense of a quick-pitch sweep to the corner and of a 3-step swing pass to the same area are, for all practical purposes, identical. There is no actual utility in "running to set up the pass" or vice-versa: this line of thinking is accidentally correct some of the time, because the true choice facing an offense is which area of the field to attack on a given play. By attacking one area of the field the offense forces the defense to adjust, opening up another area of the field. The reason the run/pass view of the world is accidentally correct part of the time is that the deep areas of the field are much harder to attack with running plays, so when an offense is attacking the short frontal area to open up the deep outside areas, doing the first part with run plays and the second part with pass plays, then tv analysts are not wrong when they say they are running to set up the pass. However, the offense could do exactly the same thing with shovel passes or shallow crosses instead of runs. I suspect that if you do not somehow account for the similarity of some runs to some passes (eg. shovel passes and draws), you will bias your results. But I will definitely be interested in the results, either way.
Will-complete agree. Everything I'm doing is predicated on an over-simplified run/pass dichotomy.
are going to factor in sacks in the next analysis?
Sorry. I wasn't clear at all above. The YPA I used is actually "net YPA," which includes all yardage gained or lost on a passing play including sacks.
Interesting article. What about the other anchor point (i.e. near 100% run vs. run defense)? 3rd or 4th and 1 seem like a good place to look, but then adjusted YPA becomes even more misleading because of the utility of small gains.
Also, I'm curious as to why you drew the blitz line the way you did.
Brian,
Interesting. I'm fascinated by the fact that the YPA for passing on 2nd down drops by almost a full yard while the increased gain from running is only .2. Are defenses just plain "better" on 2nd and 10? (maybe skewed data to the "losers"?) Or is this not as significant as I think.
It does seem to lend credence to the conventional wisdom that a 2nd down and 10 run is a good play call to get half of it, but not for the reason I would think.
The other behaviorialist issue I can think of (but can't think of a good way to test it) is this "get half of it" conventional wisdom: on first and 10 teams tend to use their whole arsenal, i.e. go deep, short medium; on 2nd and 10 maybe they are just going for shorter passes? Maybe that could be answered by looking at the variance for those YPA numbers.
Sorry for the speculations: good post.
>>Are defenses just plain "better" on 2nd and 10?
I think that's kinda the point of the article. Defenses aren't really "better", but their proficiency on 2nd down increases because the offense becomes more predictable. As you pointed out, an offense on 1st-and-10 tends to exploit their "whole arsenal", thus making them the hardest to defend because they could conceivably attack any area of the field.
Brian, did you do anything to adjust for the fact that bad teams will get more 2nd and 10s and 3rd and longs thus biasing the averages?
A set of 2nd and 10 and 3rd and long plays will be over represented by bad teams. You could adjust for this by looking at the changes in average by team by year from first down to second down or change in average from first to second down by team by game.
Nice work and interesting to read. Please keep it up. I know it would mean more work but it would be nice to see the breakdown for 1st and 10, 2nd and long cases (8 to 10+ yards), 2nd and Medium (4-7), 2nd and short (3 or less), 3rd and long (8 to 10+), 3rd and medium (4-7), and 3rd and short (3 or less). On the stat side that would be interesting to look at if possible.
On the play calling side though I don't think this type of study ever really gets us anywhere. Coaches have to call a specific type of run (iso, counter, inside zone, outside zone, power, etc.) to a specific gap (strong side a, b, c, d, or weak side a, b, or c, etc.) What run they call depends upon the type of front faced (under, over, even, odd, bear, etc.) That is based off of tendency reports and team strength.
Same is true for passing game (type of pass vs. type of coverage). A lot of plays work due to good execution and not just surprise or maintaining equilibrium. Texas ran Zone Option Read with Vince Young to a national championship...everyone knew it was coming...just could not stop it.
I disagree with this conclusion: "Which teams are more likely to face a lot of 2nd and 10s and 3rd and 10s? The ones that stink at passing."
What about the teams which very predictably ran into a wall on 1st and 2nd downs, forcing 2nd and 10 or 3rd and 10? The teams who stunk at passing didn't try to throw on 1st down, and probably not on 2nd down either.
Teams who stink at running can just as easily face a lot of 2nd and 10 and 3rd and 10. Also, teams who move the ball will have longer possessions and see more 2nd/3rd and 10 although the proportion may be different.