
 This post follows a discussion of how to rate running back performance (or team rushing performance) that began at PFR and continued at Smart Football. I'll add my two cents here.
Yards per carry (YPC) is a useful stat, but it doesn't tell us everything we want to know. Median yards gained isn't very useful because, with rare exceptions, every RB will have a median gain of 3 yds. There are any number of suggestions for alternate measures such as yards above team median, yards above replacement, or success rate (the Hidden Game of Football system used by Football Outsiders). The comments at the Smart Football post feature a great discussion of the topic. Unfortunately, there really is no single number that can capture the full picture. In fact, what we really need is a picture.
I'll explain that in a minute, but first I want to address an age-old water cooler question that Chris discussed in his post at Smart Football. Consider two RBs, both with identical YPC averages. One however, is a boom and bust guy like Barry Sanders, and the other is a steady plodder like Jerome Bettis. Which kind of RB would you rather have on your team?
The answer is it depends. Essentially, we have a choice between a high-variance RB and a low-variance RB. When a team is an underdog, it wants high-variance intermediate outcomes to maximize its chances of winning. And when a team is a favorite, it wants low-variance outcomes. Whether those outcomes occur through play selection, through 4th down doctrine, or through RB style isn't important. If you're an otherwise below-average team, you'd want the boom and bust style RB. If you're an otherwise above-average team, you'd want the steady plodder.
The same concept applies within a game. If you're losing during a game, you have become the underdog no matter how strong your team seemed on paper before kickoff. In this case, you want to increase the risk-reward balance with high-variance plays. You'd accept the risk of a 10-yd loss in the backfield for the possibility of breaking a 40-yd run. But if your team is up by a TD, the 10-yd loss isn't so acceptable.
Further, even if the high-variance RB has a lower average YPC, we'd still might want him carrying the ball when we're losing. This is due to the math involved in competing probability distributions.
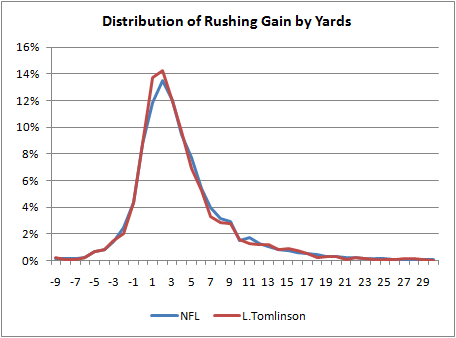
Now back to the question on how to evaluate a RB or team rushing game. Mean, median, or even mode are handy ways of describing a central tendency. But on their own, they don't paint the whole picture. It's a bit like the proverb about several blind men each grasping a part of an elephant. We could say that LaDainian Tomlinson's 4.4 career YPC figure is good because it's above average, but it doesn't tell us much more than that. It's like grasping the elephant's trunk. Instead, we can look at the whole elephant.
Below is the distribution of Tomlinson's career gains. The horizontal axis are the gains, and the vertical axis represents how often he got each gain. The blue line is distribution for the NFL as a whole, and the red line is Tomlison's distribution.
We could simplify the distribution into large bins selected for certain signifcance. For example, we could divide the distribution into all losses, gains of 1-4 yds, 5-10 yds, and 10 yds or more. Tomlinson might be a "10/45/35/10." This is unwieldy, but it's not much different than how the baseball guys use a similar shorthand for wOBA, BAPIP, and the other stats they often bundle together.
Not that I'd ever expect anyone to use this, but we could use a more technical shorthand. The RB gain distributions can be modeled as a gamma distribution, a bell-type curve described by 2 parameters--k and theta. For example, Tomlinson is a Gamma(11, 1.1). That's about all we'd need to know to reproduce his gain distribution. The parameters are not intuitive at all, so it's not a workable solution. (Perhaps someone out there might suggest a better type of distribution to use.)
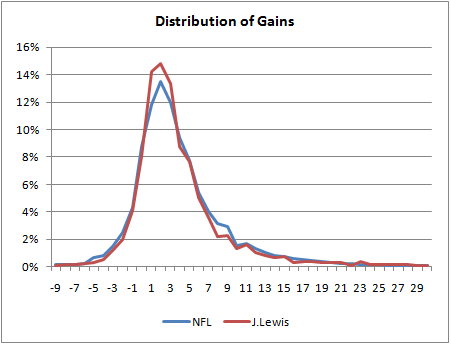
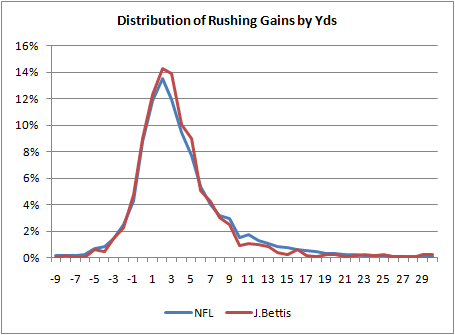
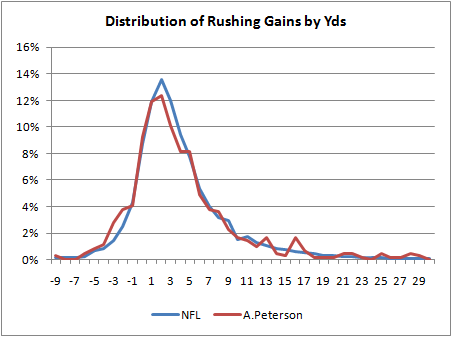
To be honest, I was expecting a bigger difference between Tomlinson and the rest of the league. So I looked at some other RB's distributions. I wanted to see a difference between boom-and-bust guys and plodder-types. I picked Adrian Peterson and Brian Westbrook to compare to Jerome Bettis and Jamal Lewis. Their distributions are plotted below.
What amazes me is how similar they all are to each other and to the league average. One notable exception is Jamal Lewis' peak. He has significantly more runs of between 0 and 3 yards than other backs. If you read the plot the wrong way, this might appear good, but it's defninitely not. Usually, a RB needs 4 to 5 yards to just break even in terms of his team's probability of converting a first down. What we'd want to see on a RB's distribution is as much probability mass as possible to the right of 4 yards.
So if Bettis' distribution looks so much like Tomlinson's, how does Bettis have a 3.9 career YPC and Tomlinson have a 4.4 career YPC? As others have noted previously, the difference among RB YPC numbers primarily come from big runs. It's the open field breakaway ability that separates the guys with big YPC stats from the other RBs. Of Tomlinson's runs, 1.5% were for 30 yards or more. Bettis' 30+ yd gains comprised only 0.46% of his carries. The other RBs and the league average are as follows:
NFL 0.91%
Lewis 0.88%
Westbrook 0.93%
Peterson 2.20%
Adrian Peterson's 2.2% figure is exceptional. It's interesting because it really suggests that what separates Peterson as a great runner is based on only 2% or so of his runs. Otherwise, he's practically average.
Of course, the usual caveats apply. When talking about a specific RB, we are really talking about his team's running performance when the RB has the ball. And we haven't considered game situation yet. Ideally, we'd want to plot a series of distributions, one for each typical down and distance situation--1st and 10, 2nd and long, 2nd and mid/short, and 3rd and short. But that's a far cry from a nice handy single number.
Comparing Running Performance

published on 8/13/2009


Subscribe to:
Post Comments (Atom)
Why not just use WPA per carry? This would capture not only gross productivity but also "down appropriate" risk-taking and clock management, e.g. running out of bounds in two minute offense and staying in bounds in four minute offense. In theory, WPA/c would tell you which backs give your team the best chance to win on a per carry basis, correct?
Also, gamma(11,1.1) doesn't sound overly complex to me (OPS is also two parameters, and that's caught on pretty well), but if what you want to express is the probability of mass to the right of, say, 4 yards, why not just say it? Integrate the pdf from 4 -> +inf to yield the percentage of a RB's rushing production that gives a greater than 4 yard gain. The higher the number the better the RB.
...I just remembered that the integral of a pdf is the cdf. So if 4 yards is the critical point that you want a back's probability mass to fall to the right of, then you want to calculate the gamma cdf(4;k,theta). The lower the number the better the RB.
What if you redid the graph as "percentage of league"? Then you'd see more clearly on the right side which RBs were better than average at the long run. Although there might be a lot of noise, there, I guess.
I'd love to see these charts with each team's RBs from a given year together, rather than just "RB" and "NFL". That'd give a better picture (maybe?) of how much the OL and context contribute to an RB's output.
Tag teaming on Will's post. You could also assign a value to each yardage gain and with something like expected points and use that value for the graph instead of yardage and also integrate over that value.
I am assuming the the value of a run on first down in a tie game is non linear in yards so the integrated value would depend on the higer moments of the distribution and so would give an idea of which back was "Best" trading gains vs losses.
I'd be interested to see what these graphs would look like if the y-axis were total yards gained (for that length run) rather than probability of gaining that number of yards. For example, the y value for an x value of 4 would be 4 * the number of 4-yard runs.
Then 1) the area under the curve would be the total number of yards gained for the season by that player, and 2) the positive effect of long runs would stick out more.
If I read that correctly, then the Gamma distribution isn't going to get you exactly what you want, as it only models non-negative numbers.
Ryan,
I assume Brian shifted the numbers upward to make them all positive, then shifted them back for the graphs. (Correct me if I'm wrong here) Unfortunately, the gamma function is not defined for negative numbers, but fortunately it simplifies to an easy factorial function for integers, and NFL rushes are all recorded as integers. So I think a gamma-based model should be workable.
The expected value of a gamma is the product of the two parameters. This would place Tomlinson's expected rush at 11*1.1= 12.1 yds/carry. As a Chargers fan I could only dream!
While the distribution of a gamma(11,1.1) may have the correct shape, the location of your fit is off. I would suggest another distribution as per Ryan J. Parkers point that the gamma is for non-negative data.
You have a baseline distribution and your discussion centered around the difference between the runner and the rest. Why not explore the difference as the basis for the analysis?
Possible approaches include: average of the difference, a best fit type approach where the slope of the best fit of the difference vs yds should be interesting.
I'm reminded of a quote by former Vikings RB Leroy Hoard:
"I told the coach, if you need one yard, I'll get you three. If you need five yards...I'll get you three."
Re: Anonymous (same team, different RBs)-
Backup RBs may not be used in the same situation as starters are. If the starter is a "Bettis-type," the #2 might be a "Sanders-type" and vice versa. Furthermore, backups might get used more in running-out-the-clock situations and definitely get used more in blowout situations.
Thanks for the great suggestions.
Yes, the gamma distribution was shifted right by 9 units.
True--backup RBs often get the 3rd and long 'trash' yards--8 yd draws on 3rd and 10.
Using expected points is a good idea, but it's going to heavily favor the "scavenger backs." Expected points is pretty linear anyway, and only bends perceptibly near the goal lines. But it would account for down/distance situations.
WPA is neat, and I plan to unveil player WPA stats shortly once I complete a major upgrade to the WP model. But this may over-weight situation. RBs don't call their own number or control the game situation. RBs on teams that are on very good or very bad teams will get lots of meaningless carries, shortchanging their WPA numbers.
One idea I had was to redo the Hidden Game of Football system that Football Outsiders has used (with modifications). The HGoF system counts plays as successes if they gain 4 yds on 1st down, >50% of the remaining yards on 2nd down, and a conversion on 3rd and 4th downs. FO adds some modifiers such as bonus points for surplus yards gained and situation effects. But this system is not continuous or proportional, nor is there any "units" to the stat--just "success points."
I think a far better system would be to do a system based on '1st down probability added' (1dPA). Every 1st and 10 starts with a 0.67. If a RB gains 3 yds, that might be a -0.10. If he gains 6, that might be a +0.20 or whatever. If he gains 30 yards, that would be +0.66 (because he essentially got 2 first downs).
I think something like this could be a very useful, intuitive stat for (smart) fans, and it would be a valid utility function for analysts at the same time. We could add defense adjustments and situation adjustments if we wanted.
Brian,
This is fourteen miles off any point you're discussing, but you're about the only person who could provide me with an answer, so I'm going to ask it.
Do you foresee a day anytime soon when it will be possible to assign a specific and uniform "win contribution" total to each and every participant on a football team like basketball's Win Score or baseball's Win Shares?
I realize football is such a complicated and communal sport, but there must be some specific quantifiable win value an above average or below average left guard or nose tackle or even punter brings to a team. Otherwise why hold training camps tryouts at all? Why care about quality at those positions if they don't somehow matter, even microscopically, to the team's win-loss total?
I like Dave Berri's QB Score and RB Score, but focusing on two positions is sort of like playing "Hike PK" if you get what I mean. There must be a more holistic possibility.
Thanks Brian. Keep up the great work...
Got to be a Win Probability Added score surely. That's got to be the basis of any player metrics for this site, surely.
Interesting to see how little variation there is among completely different styles of running back. Perhaps a running game is more about the blockers than the runner. After all, Denver seem (or used to at least) to be able to put anyone at RB and they'd run for a 1,000 yards.
Is there a similar trend among receivers and their yardage gained, or do some receivers tend to get more long receptions than others?
Brian,
I was thinking about the Win Probability Added (WPA) and I don't think that tells you as much as you might think about the ability of a running back.
Let's take an example, 45 seconds left in the 4th quarter, it's 3rd and goal from the 10 yard line, down by 4 points. Basically a touchdown will give you a a 99% chance of winning and failure to score a touchdown guarantees a loss. WP is 18.
If I'm using your WP calculator correctly, if they hand the ball to the running back and he gains 8 yards it will be worth -17 WPA. It is now 4th and goal from the 2. 8 yards is a great run but it doesn't help the team win. They hand the ball to the back again...if he scores a touchdown it's worth 98 WPA. If he doesn't it's worth -1 WPA.
Using straight WPA measures how the RB is used as much as how much he helped. Frankly the odds off rushing the ball twice for 10 yards from the 10 yard line with 45 seconds left in the game aren't good and the team probably should have passed on 3rd down. Because the coach decided to run the ball, the RB gets the WPA. And WPA is a LOT higher (positive or negative) than 3rd and 10 from their own 30 yard line in the 1st quarter.
That's why football outsiders doesn't use straight success rate. They compare a RB's success on a play to the average RB's success on that down and distance. Rushing on 3rd and 12 almost never produces a 1st down. If the RB gains 10 yards in that situation they shouldn't be penalized for not converting.
You are left with the choice of comparing a RB to other RB's or comparing a RB to other RB's in the same situation (down and distance)
Ben-I agree WPA would be very limited for player evaluation. It's really useful for knowing what a actually player 'did' in the past, and not necessarily what he could be expected to do in the future, primarily due to the varying leverage of different game situations. As you point out, it can very sensitive to the leverage of the situation.
However, as it seems to me, WP inherently takes game situation into account in a very simple way. For example 3rd and goal from the 2 in a tie game might give the offense a 0.65 WP. That's because WP "expects" a TD at exactly the league-average rate. After a TD run, the WP would be, say 0.68, giving the RB a +0.03 WPA, and not a +0.18 or whatever. So WP *added* is not necessarily a lot higher.
By the way, at this point, don't rely on the current WP calculator for individual play WPA. Unless you're analyzing big swings in WP for a 4th down situation or something similar, there is too much noise in the current model to do this. I'm waiting until I complete a revision of the model with much better noise reduction to do WPA for individual plays.
Your example about 45 sec left in the game is true. A coach that calls for the run then would usually be killing his RB's WPA, and that's an unfair mark against him. I agree. I suppose WPA would have to assume a rational (non-suicidal) coach, which isn't always a true assumption!
So while I agree WPA would be limited for individual player evaluation, it may have some very useful and interesting advantages. One neat advantage is that you can sum up a player's or squad's WPA for a season, and see how many equivalent wins he contributed. If we agree a 0.05 WPA is 5% of a win, the same way saving up $5 is 5% of the way to $100, then it's pretty handy. We can do this because the units of WP are in "wins." Other stats that are in terms of points or yards or '% above average' can't do that.
PS Will-Why did you delete your comment?
Ty-I would say of course they matter. Lineman and their contributions are critical. It's just that purely quantitative statistics can't do the job of evaluating their contributions in isolation. Statistics is really just fancy ways of counting things.
For measuring individual lineman contributions, and for individual contributions of all positions really, the best avenue is probably qualitative expert analysis. Only the coaches know what a player was supposed to do on a play. Even a great block on the wrong player is bad, and a layman would never know the difference.
I think advanced stats could help once the qualitative scoring has been done. Sample size analysis, confidence intervals, value and salary estimates, score-equivalence or win probability-equivalence could be very helpful.
Ben-I have a question. I honestly don't know the answer. Would FO's DVOA account for the situation you described (3rd & long near the goal line)? In other words, does DVOA distinguish between the run and the pass?
I know you can sum up DVOA for runs and passes separately, but would the DVOA system penalize the RB in that situation the same way WPA would? Say in that situation, teams score TDs 25% of the time by usually passing. But the RB has about a 5% or lower chance of running it in. Does DVOA compare runs against runs or plays against plays in certain situations?
Reading through their summary of how DVOA works, I found this:
"Every single play run in the NFL gets a "success value" based on this system, and then that number gets compared to the average success values of plays in similar situations for all players, adjusted for a number of variables. These include down and distance, field location, time remaining in game, and current scoring lead or deficit. Teams are always compared to one standard, as the team made its own choice whether to pass or rush. However, when it comes to individual players, rushing plays are compared to other rushing plays, passing plays to other passing plays, tight ends get compared to tight ends and wideouts to wideouts."
Given a situation where, "Say in that situation, teams score TDs 25% of the time by usually passing. But the RB has about a 5% or lower chance of running it in" they would be penalizing the team's offensive DVOA for choosing a less effective play but not penalizing the RB.
I thought that I should let you know that WPA is brilliant for summarizing which things really changed the balance of the game (retrodictive).
It is probably quite effective is predicting team performance (a large number of plays helps to balance out the fact that some are worth a lot more than others and coaches probably make the same decisions again and again).
I'm not sure how well it predicts individual acomplishment because it is very heavily affected by situation and coaches decisions. I think that to be predictive of individual players you would have to compare what they did to what other players do in the same situation. A WPAAA (Win Percentage Added Above Average).
Thanks, Ben. Sounds like DVOA is doing it the right way. I agree with your take on what WPA would bring to the discussion. I see it as 2 things:
1. The best tool possible for game decision analysis.
2. A fun way of quantifying a play's, player's, or squad's impact on past games. This would be useful for things like Hall of Fame or MVP discussions.
The comment I deleted was to use average percentage of yardage-to-go gained. Then I thought better of it, due to the extreme over-rewarding of gaining much more than a first down.
For all the great statistical work that is being done out there, I believe there is a bit of overanalyzing going on.
Lets use basketball as an example. I believe that the Wins Produced model is the best model out there. It sticks strictly to boxscore analysis. I belive football analysis should try to emulate this model.
Its my opinion that the current state of football analysis(to give an example using basketball) is trying to explain every pass against a full court pressing defense. Basketball analysis simply records a made/missed basket, a turnover, offensive rebound, or a free throw attempt. Wouldn't it be tremendously hard to try and explain basketball success pass by pass and pick by pick?
Why can't football analysis be so simple?
Each drive would become a possesion.
Each conversion similar to an offensive rebound.
Turnover is still turnover.
Each punt forced is a defensive rebound.
Tackles and tipped passes are similar to blocked shots.
Penalties are like personal fouls.
Each time the ball is put in scoring position an assist is recorded.
Each time an actual score is recorded is a successful posession.
You would then have "grades" for each player and could evaluate them according to players that play the same position.
For instance corner backs would have exceedingly low scores but once you adjusted for position you could evaluate individuals according to their peer group.
Eddy Elfenbein had a very interesting article on this subject last December. He points out that the toughest yard in the NFL is the 4th yard on a run.
http://www.crossingwallstreet.com/archives/2008/12/rushing_yards.html
As far as gamma distribution. The two parameters you publish can be Mean and Mode. Theta is Mean-Mode, and Kappa = Mean/Theta.
Sorry this is, like, 6 years old.