
 Next up in Koko the monkey's fantasy rankings are the running backs. In case you aren't familiar with the Koko rankings, they are the simplest projections possible based on previous-year performance. The rankings are intended to serve as the baseline for the bare-minimum accuracy we should expect from all other fantasy projections. A full explanation can be found in the write-up for the QB rankings.
RBs are notoriously difficult to predict. While a starting QB can be expected to have the vast majority of his team's snaps, starting RBs often share snaps with backups. The dreaded RB-by-committee makes it difficult for a simple quantitative system to account for the varying expected number of carries each RB can get.
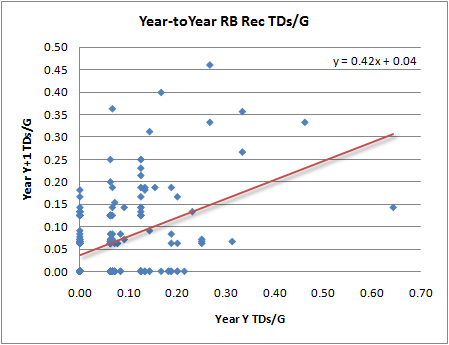
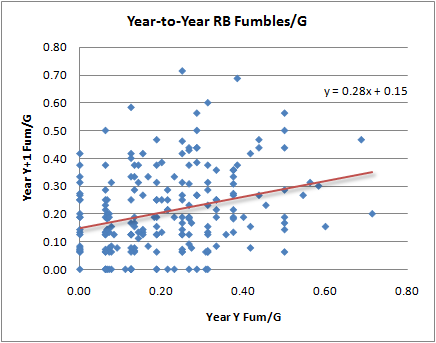
Still, the regression plots show us we can still project RB per-game production fairly well. I tried the projections two different ways. One way was to estimate production per run--yds per rush and TDs per rush--and then project the number of rushing attempts for each RB. The second method simply projected per game production--yds per game and TDs per game--without regard for the total number of carries. The two methods were equally accurate, so I chose the second, simpler method.
Here are how the per-game stats project for RBs. I looked at rush TDs/G, rush Yds/G, receiving TDs/G, receiving Yds/G, and Fumbles/G.
Next are the rankings. I used the standard fantasy scoring--6 points for TDs, 1 point per 20 yards of rushing or receiving, and -2 points for fumbles. Top RBs tend to play in 14 games in a season, so I used that as the basis for the total season projection. I scratched guys like Warrick Dunn and Edgerrin James off the list, but if I missed anyone let me know. Marshawn Lynch was docked for 2 games worth of points, instead of 3, which is his actual suspension. I did this because he now has 3 fewer games in which he could injured. For rookies like Knowshon Moreno, you can project them as tied for 46th until I have a better systematic way to project rookies.


| Rank | Player | RYds/G | RTDs/G | ReYds/G | ReTDs/G | Fum/G | Pts/G | Proj Pts |
| 1 | DeAngelo Williams | 81.3 | 0.80 | 11.3 | 0.09 | 0.15 | 9.7 | 135.6 |
| 2 | Michael Turner | 87.1 | 0.77 | 8.3 | 0.04 | 0.20 | 9.2 | 129.0 |
| 3 | Brandon Jacobs | 75.7 | 0.82 | 8.4 | 0.04 | 0.21 | 8.9 | 124.6 |
| 4 | Brian Westbrook | 67.2 | 0.56 | 24.0 | 0.19 | 0.19 | 8.7 | 121.5 |
| 5 | Thomas Jones | 74.8 | 0.65 | 14.5 | 0.09 | 0.19 | 8.5 | 119.3 |
| 6 | Matt Forte | 72.5 | 0.49 | 24.7 | 0.14 | 0.17 | 8.3 | 116.6 |
| 7 | Steven Jackson | 77.3 | 0.53 | 25.8 | 0.07 | 0.27 | 8.3 | 115.5 |
| 8 | LaDainian Tomlinson | 68.4 | 0.59 | 22.8 | 0.06 | 0.17 | 8.1 | 113.6 |
| 9 | Maurice Jones-Drew | 59.3 | 0.62 | 28.0 | 0.09 | 0.26 | 8.1 | 113.3 |
| 10 | Adrian Peterson MIN | 89.1 | 0.56 | 11.4 | 0.04 | 0.31 | 8.0 | 111.4 |
| 11 | Chris Johnson | 74.8 | 0.54 | 17.1 | 0.06 | 0.17 | 7.9 | 110.6 |
| 12 | Steve Slaton | 73.9 | 0.52 | 20.9 | 0.06 | 0.20 | 7.9 | 110.0 |
| 13 | Clinton Portis | 80.4 | 0.52 | 14.9 | 0.04 | 0.20 | 7.7 | 108.1 |
| 14 | Frank Gore | 70.8 | 0.46 | 22.8 | 0.10 | 0.27 | 7.5 | 104.4 |
| 15 | LenDale White | 57.7 | 0.71 | 7.3 | 0.04 | 0.17 | 7.4 | 103.5 |
| 16 | Pierre Thomas | 54.3 | 0.54 | 18.1 | 0.12 | 0.17 | 7.3 | 101.7 |
| 17 | Marion Barber | 63.1 | 0.48 | 23.5 | 0.09 | 0.28 | 7.2 | 100.5 |
| 18 | Reggie Bush | 53.7 | 0.34 | 33.3 | 0.20 | 0.23 | 7.2 | 100.4 |
| 19 | Ronnie Brown | 62.3 | 0.56 | 16.3 | 0.04 | 0.17 | 7.1 | 100.0 |
| 20 | Le'Ron McClain | 61.8 | 0.56 | 11.3 | 0.06 | 0.22 | 6.9 | 96.9 |
| 21 | Kevin Smith | 64.2 | 0.49 | 17.5 | 0.04 | 0.19 | 6.9 | 96.4 |
| 22 | Sammy Morris | 61.6 | 0.51 | 14.2 | 0.04 | 0.17 | 6.7 | 94.3 |
| 23 | Joseph Addai | 56.2 | 0.45 | 17.1 | 0.11 | 0.17 | 6.7 | 93.3 |
| 24 | Willie Parker | 69.7 | 0.47 | 7.4 | 0.04 | 0.15 | 6.6 | 92.3 |
| 25 | Dominic Rhodes | 51.4 | 0.44 | 18.8 | 0.12 | 0.15 | 6.6 | 92.3 |
| 26 | Jonathan Stewart | 59.7 | 0.56 | 8.4 | 0.04 | 0.19 | 6.6 | 92.2 |
| 27 | Willis McGahee | 59.4 | 0.51 | 14.7 | 0.04 | 0.21 | 6.6 | 91.9 |
| 28 | Larry Johnson | 70.2 | 0.45 | 10.4 | 0.04 | 0.27 | 6.4 | 89.9 |
| 29 | Earnest Graham | 61.8 | 0.44 | 17.2 | 0.04 | 0.21 | 6.4 | 89.8 |
| 30 | Marshawn Lynch | 68.3 | 0.51 | 18.8 | 0.06 | 0.19 | 7.4 | 89.1 |
| 31 | Ryan Grant | 71.4 | 0.37 | 11.1 | 0.06 | 0.22 | 6.3 | 87.8 |
| 32 | Tim Hightower | 45.8 | 0.56 | 15.6 | 0.04 | 0.19 | 6.2 | 87.5 |
| 33 | Derrick Ward | 65.7 | 0.31 | 21.2 | 0.04 | 0.19 | 6.0 | 84.4 |
| 34 | Jamal Lewis | 65.0 | 0.37 | 13.4 | 0.04 | 0.19 | 6.0 | 83.7 |
| 35 | Mewelde Moore | 51.8 | 0.40 | 18.8 | 0.06 | 0.17 | 6.0 | 83.6 |
| 36 | Cedric Benson | 64.8 | 0.33 | 16.0 | 0.04 | 0.20 | 5.8 | 81.6 |
| 37 | Darren McFadden | 52.7 | 0.40 | 19.9 | 0.04 | 0.21 | 5.8 | 81.2 |
| 38 | Chester Taylor | 45.8 | 0.37 | 21.7 | 0.09 | 0.19 | 5.8 | 80.5 |
| 39 | Ricky Williams | 54.1 | 0.37 | 15.0 | 0.06 | 0.24 | 5.6 | 77.9 |
| 40 | Fred Jackson | 51.3 | 0.34 | 18.7 | 0.04 | 0.19 | 5.4 | 75.2 |
| 41 | Maurice Morris | 55.6 | 0.24 | 13.0 | 0.10 | 0.17 | 5.2 | 72.2 |
| 42 | Justin Fargas | 64.1 | 0.28 | 8.9 | 0.04 | 0.21 | 5.1 | 71.8 |
| 43 | Julius Jones | 56.8 | 0.31 | 9.3 | 0.04 | 0.22 | 4.9 | 69.1 |
| 44 | Fred Taylor | 54.9 | 0.28 | 11.2 | 0.04 | 0.17 | 4.9 | 68.3 |
| 45 | Ray Rice | 50.9 | 0.24 | 19.4 | 0.04 | 0.17 | 4.9 | 67.9 |


One thing I would do is break down rushing yards per game into YPC and carries. I think this might improve the results.
Chase - I suggest reading the article before you comment on it.
IMHO, when you try a fit lines thru clouds of data, you need to keep in mind the scaling of your axes. The standard deviation of the data in Fig. 2 (rush yds/gm) looks to be about 20 yds/gm. So for a 67% confidence interval, your results should be within 20 yds/gm of the true number. That's a HUGE drop-off, especially when you factor in similar results for tds/gm. This is 1st round pick to 5th round pick type unpredictability.
As always, when using statistics you can't just publish your results. You need to say how useful they are in making decisions. I think we'd both agree (after all, you call these the "koko fantasy rankings") that the answer is you probably shouldn't make ant decisions based on these data.
mvp,
I read the article -- I think you need to regress both carries/game and YPC. YPC is highly susceptible to regression to the mean, as are carries per game. Rushing yards per game, of course, is, too. But I think in different ways. I think YPC is more susceptible to big plays, and therefore, players regress there at a quicker rate than carries per game.
Maybe Brian can provide a more full explanation.
Hm, it seems that Koko isn't so good with RB's. I don't think any of the projected top 5 RB' should actually be in the top 5, and most of them don't deserve to be in the top 10.
Brendan-We'll see! I agree RB is the toughest position for a naive system to project.
Also, Chase raises a good point. I did the projections both ways, a straight year-to-year regression and a model regressing both per-carry stats and carries per game.
The total projected points for each RB under both methods were very, very close (usually within about 3 points for the whole season), so I chose the simpler method (for now).
i insist you use receptions/game. thx