
 Is quarterback performance related to where a passer is taken in the draft? It may seem like a silly question, but the answer is more complicated (and controversial) than it first seems. What if I said that the correlation between a QB’s draft rank and his career adjusted Yards Per Attempt (AdjYPA) is only -0.07? You’d think that’s amazingly small. (The correlation coefficient would be -1 if the relationship between draft order and performance is perfectly proportional, and it would be 0 if there is no relationship at all.)
What if I told you the correlation coefficient is -0.72? That’s more like it, you’d think. But which correlation coefficient is correct? They both are.
Difficulties in the Analysis
There are several wrinkles to the question of whether draft position is related to QB performance. The first deals with opportunity. Top picks will be offered more opportunities to play than later picks. This would be due to two causes: one, the top picks may be better players; and two, teams have invested sunk costs in acquiring them. It’s impossible to separate and measure the two causes.
To partially address the fact that top picks tend to get more starts and more pass attempts, we should use per-play “rate” stats as a measure of performance. Using aggregate “total” stats would favor the top picks. Unfortunately, there are many QBs who never played a down or who attempted so few passes that their stats are very erratic due to their small sample size.
Typically, to avoid the low sample size problem caused by these players, we use a cutoff of a minimum number of pass attempts, say 100 or 200 career attempts. By using a cutoff, however, we create a second major problem—selection bias. The draft itself is fundamentally a process of selection, so selection bias is going to be a large issue.
If we only consider those players who are good enough in their coaches’ eyes to play, we’re seeing an unrepresentative sample of QBs. Assuming coaches have any ability to discriminate on player ability, we’d see only the players above a certain threshold of ability. The diamonds in the rough like Tom Brady will skew the analysis, while the numerous 6th-rounders who never played aren’t considered.
My initial solution was to assign an arbitrary level of performance to QBs whose total attempts were below the qualifying total. I chose the 5th percentile performance, figuring they weren’t good enough to play much in real games, but it would be unfair to say they would all be as bad as the worst player in the group.
Dave Berri, whose research sparked the debate about whether top picks are any better than later picks, convinced me that my approach may penalize non-qualifying QBs too much. But we shouldn’t only look at QBs good enough in their coaches eyes to play, and we can’t know how well the guys who didn’t get to play would do given a fair opportunity. I suppose the real question is how to consider low-attempt QB careers. (More on this in a subsequent article.)
An alternate way to include the performance of all QB draft picks without suffering the erratic effects of low sample sizes is to aggregate the passes of all QBs at a certain order in the draft. In other words, we think of all 1st round QBs as a single case, all 2nd round QBs as a single case, and so on. We could repeat the same analysis, but instead of using draft rounds as our “bins,” we can use position order--first QB taken, second QB taken, and so on.
The problem with this approach is that QBs with longer careers, who are the better QBs, are going to bias the numbers because they contribute more weight in the average. But I’ll accept this “survivor” bias for now because it favors the later round diamonds in the rough. If we can still detect a significant relationship between draft position and performance despite this bias, we could safely confirm that better QBs really are drafted earlier.
Measuring the Correlation
As the measure of performance, I’ll use Adjusted Yards Per Attempt (AYPA), which is yards per pass attempt with a 45-yard penalty for each interception. The correlation coefficient between overall draft order and AYPA is 0.07. But we get very different answers when we group picks together.
The first graph plots AYPA by overall draft order, grouped by bins of 10. Keep in mind there is still the matter of survivorship bias due to the diamond-in-the-rough effect.

The correlation coefficient becomes -0.22, which is relatively weak but still stronger than the original -0.07.
But now let’s look at AYPA by draft round, which is essentially the same as grouping picks in bins of about 30.
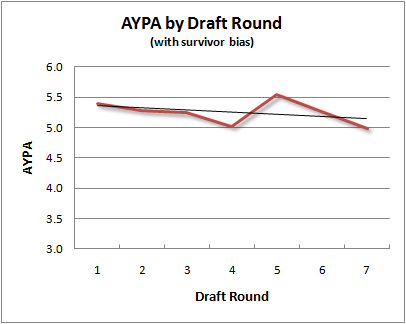
The correlation coefficient is now -0.38, which is considerably higher, especially in light of the diamond-in-the-rough bias.
Let’s look at the relationship a third way. The next graph plots AYPA by position-order, that is, the 1st QB taken, the 2nd QB taken, and so on.
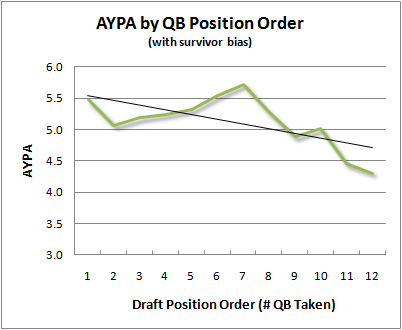
The correlation coefficient now becomes -0.72, which suggests draft order really can predict QB performance. Even if we lop off the 13th QB taken from the analysis (there are relatively few of them), we’d still get a correlation of -0.64.
Correlation Coefficients Can Be Deceiving
Why do we get such different answers to the question of how well draft order correlates with performance? The reason lies in how correlation coefficients are calculated. Correlation coefficients are a measure of how much variance two variables share. Variance is an abstract concept, defined as the square of the difference from the mean to the actual value. It always has at least two components:
var(observed) = var(true) + var(random error)
The larger we make each “bin” of comparison (the groupings of the various cases),the more the random sample error is averaged out. Sample error tends to be reduced with larger samples. Consequently, the share of the observed variance that is “true” and not due to sample error is increased. By definition, the random error component of the variance of a variable will not correlate with that of another variable. The result is that correlation coefficients will be higher when we group cases into larger bins, and they will be lower when we group cases into very small bins.
In fact, theoretically, if we only used 2 very large groups of cases, say top 3 rounds and bottom 3 rounds, we could create a correlation coefficient of -1.0. Correlation coefficients can be deceiving. If you took the -0.07 correlation at face value, you might wonder if teams would be better off signing a couple late-round QBs for the rookie-minimum salary than mortgaging the farm to sign a top prospect.
Further, the overall draft order is a function of many more things than just the expected performance level of the QB. There are team-specific needs to consider, plus there are players at other positions of varying ability that affect when a particular QB is taken in the draft. The position-order of a QB pick is a function of fewer factors, so the ratio of “true” variance to variance from other factors is higher. Consequently, the correlation coefficient will be stronger when we look at performance according to position-order rather than overall order.
We’re still a long way from knowing the final answer about the connection between draft order and performance, but these results suggest there is a relationship of some degree despite the survivor bias in the data. If we could remove the bias, it’s logical we’d see an even stronger relationship.
But the point of this article isn’t just about the draft and QBs. It’s about how tricky the correlation coefficient (and its sister, r-squared) can be. It’s been written about before, most notably by Phil Birnbaum and Tom Tango, but it’s worth repeating in the context of the NFL draft.


Would it be interesting to see how the draft pick of a quarterback affects their chances of winning a superbowl?
Also, how having a higher average draft pick over a decade effects winning percentage/super bowl victories?
My issue with the Berri position has nothing to do with the underlying data, and is all about the interpretation of that data. Let me give an analogy.
There are two high schools in the same metropolitan area, A & B. At school A, virtually every student is encouraged by both the school district and their families to take the SAT, so 90% of each senior class takes the SAT at least once. Meanwhile, at school B, the dropout rate is higher, alot of the students that would be marginal college entrants don't see the need to try to take the test, and the school district doesn't go out of its way to encourage the rank and file of the student body to take the SAT.
The students who do take the SAT at School A and School B have roughly the same average score.
State University admits students from both schools, but the number of admissions from School A is 3x greater than School B.
Which is the most reasonable interpretation of that information?
1) State University admits students based on their school district, independent of performance, because the students who are admitted from School B do just as good as School A, yet the University continues to admit more from school A.
Or
2) State University admits students based on their performance, independent of the school district they attended.
I think (2) is closer to the truth in the NFL. The reason that the late round picks who do play end up playing about as well as the early picks who play is because the best players play, mostly regardless of draft position. The reason more early picks play is because they are generally speaking the best options at the time.
"My initial solution was to assign an arbitrary level of performance to QBs whose total attempts were below the qualifying total. I chose the 5th percentile performance, figuring they weren’t good enough to play much in real games, but it would be unfair to say they would all be as bad as the worst player in the group.
Dave Berri, whose research sparked the debate about whether top picks are any better than later picks, convinced me that my approach may penalize non-qualifying QBs too much. But we shouldn’t only look at QBs good enough in their coaches eyes to play, and we can’t know how well the guys who didn’t get to play would do given a fair opportunity. I suppose the real question is how to consider low-attempt QB careers. (More on this in a subsequent article.)"
I hope I don't steal any of your thunder, but you are alot closer to the truth than Berri. If your 5% is off, it's still a heck of a lot closer to the truth than just ignoring those players and assuming 50th percentile.
I think we can consider the guys who never played to be represented by 3rd quarterback types on rosters who were forced into action because of injury, and thus it was entirely the random hand of fate and opportunity that dictated which 3rd qb became Spergon Wynn and was included in the data set, and which played behind Peyton Manning for four years before being cut.
Not that this is a complete study, but I pulled all teams that had 3 or more different passers attempt 50 passes in the same season over the last five years. There were 20 cases (well, 21, one team had 4 passers). I then pulled the third qb's numbers (and fourth).
That group collectively had 2,449 pass attempts, and an average ANYA of 3.70. That is equivalent to Josh Freeman last year, who was 29th out of the 32 qualifying quarterbacks in ANYA last year. So that's about the 10th percentile.
Of course, that assumes that all 7th round picks are good enough to even make a roster as the third quarterback and stick for a while, so that is probably an optimistic estimate for that population of quarterbacks who were drafted but never played significantly.
Yes, you stole my thunder! But that's ok. For all the non-qualifiers in my sample, their AYPA turns out to be very close to 5%, which was originally just a guess on my part.
In defense of Berri (and Rob Simmons, his co-author), the main point of their paper wasn't that top picks were no better than late ones. His primary finding was how statistical indicators in college were extremely weak predictors of success in the NFL, and that coaches are taken with data from the combine. He reported a "quite weak" correlation between draft position and NFL performance, but that's going to be due to selection bias, plus the "bin-size" effect I wrote about. To their credit, they conclude "our model designed to predict draft position and NFL performance is incomplete and our discussion of intangible scouting data does suggest that there are omitted scouting variables in our model." On the other hand, nowhere in the study are selection bias and survivor bias addressed.
Like you, the problem I had was with Gladwell's interpretation of what Berri reported. Gladwell accepted the low correlation uncritically.
Still, the question remained stubbornly unresolved. How do we know top picks really are any better, assuming we can agree on what defines 'better'? (aggregate total stats, per-play stats, games started, etc.) I don't think either Pinker or Gladwell proved their point. And Gladwell, despite his misunderstanding of the stats, had a great point about the circularity of the logic involved: Coaches are good judges of QB talent, but only if we assume coaches are good judges of QB talent.
I think it's an interesting nut to crack, even if it seems obvious and silly to some.
This post should be required reading for any high school stats class. It's a great articulation of how stats 'lie', and what that really means.
One thing I'm interested in is how how draft order/round correlates to established starters. For example, take all QB's who've started ~40 games in 3 years to define an established starter. Does draft position have any correlation? IE are there more Mannings or Breeses?
Dr. O - JKL did something along those lines here.
Brian - I'm unclear how quarterbacks who played longer are contributing more weight in your analysis. You have one number per quarterback, right? And it's adjusted yards per attempt, which is used since it should theoretically be more equal for QBs with more or less experience. Better quarterbacks should play longer so I guess you could argue they have a more stable performance number, but that shouldn't affect your correlation at all.
Sorry to confuse. It goes like this: Say there were 20 "5th QBs taken" in my sample. One of them was Mark Brunell, and 19 of them were guys you never heard of.
Brunell's passes make up well over 50% of the passes thrown by all "5th QBs taken" because he was the one guy who was fairly successful. The better the QB, the more likely he survives to continue accruing attempts, and the more weight he gets in the aggregate sample.
What if I said that the correlation between a QB’s draft rank and his career adjusted Yards Per Attempt (AdjYPA) is only -0.07?...
In the earliest days of baseball Sabremetics a study reached that shocking conclusion that Brooks Robinsion, a Hall of Famer good enough to start in the majors for 23 years, was over his career a below-average third baseman.
This gave a big spur to the development of "positive value" measures (above replacement value, career total postive value, etc.) as opposed to "compared to average" measures.
The reason why Brooks' career average rated so low compared to the generic average third-baseman was that in his years 18, 19, 20, 21, etc., he was still far enough above replacement level to be an MLB starter -- which was great for such an old geezer! -- even though his level of play had slipped to below league average, so it drove his career average down.
OTOH, when Brooks' career positive value was totaled up, it was tremendous. The other third basemen who had comparable "average" performance levels did so at their peaks for only three, four, five seasons, then got cut when their play started to slip. So their average level of play was never deflated by their play at ages 37 to 41.
Mickey Mantle's "career average" numbers took a big plunge too as he played on and hit only .256 over the last quarter of his career. But his career total positive value was pretty impressive too.
The point is, the best QBs who have the longest careers seem, by the same logic, likely to have deflated "career average" AYA, relative to more modestly talented QBs, who aren't good enough to have long careers and have their "fall off years" counted in their average AYA.
So, I'd have reservations about using "career adjusted Yards Per Attempt" as the measure of comparison. The longer careers of the best players can drive regression to the mean in that stat, diminsishing the apparent difference between them and truly average players.
Another qualification is that in baseball, a player's stats really are pretty much his own. In the NFL a QB's AYA is really a team stat affected by 30 other guys. QB passing ratings correlate even with the quality of team defenses -- players who aren't even on the field at the same time as the QB -- because it is easier to pass when ahead than behind, and Ds have something to do with that. There's an awful lot of noise in the career average AYA numbers.
I'd be more inclined to use some sort of total career positive value measure to compare QBs by draft position. Coaches want to win and will give the QBs who can best help them do so the longest runs.
Berri argues that a team that invests a lot of money in a top draft pick will play him whatever, distorting such a number -- which is true, but only up to a point. The first contract lasts only so long, and coaches can afford to give away only so many games. Ryan Leaf played himself out of a job soon enough, as did Jeff George. So this argument seems exaggerated.
Joey Harrington may have gotten extra starts during his first contract because of the money invested in him -- but would we expect him to get several more contracts and start until the age of 36 due to the sunk cost of his first contract?
Berri himself says -- emphasizes! -- that AYA and such personal QB stats are highly unstable year-to-year, indicating a very large random element in them. Over a career, that drives "average year" stats to the mean. Also, long-career stats are biased back to the mean. Then we look at the result of their combination, find so many career average stats near the mean, and conclude there wasn't much difference between the players. I dunno about that.
I'd guess that QB longevity and career total positive value are better correlated to QB ability and "quality" when drafted, regardless of arguments to the contrary.
One person's opinion, FWIW
I probably sound like a broken record with this - I think I've dropped comments about this on several other posts. But I feel compelled to always point out that there is not a linear relationship between a player's performance and his value to the team.
A RB who makes 3.0 yards-per-attempt is virtually worthless. A RB who makes 4.0 YPA is, by the numbers, 33% better than the 3.0 YPA RB, but I would argue that he's MUCH more than 33% more valuable. A RB who makes 5.0 YPA is, by the numbers, 25% better than the 4.0 YPA RB, but again, I think he's MUCH more than 25% more valuable.
So even though some of your graphs above show only a gentle slope downward in terms of AYPA, I would argue that this represents a rather severe drop-off in performance and value.
It’s an interesting subject. The numbers I’m looking at for it (pro-football-reference is essential) suggest that the draft is basically a gamble. I looked at all QBs selected between 1995 and 2005, and looked at a few things.
Firstly I looked at performance (Adj Y/A) for those QBs who have had a decent length career (defined as over 1,000 pass attempts, although this is arbitary) and this suggested that if you have a player who is good enough to be an NFL QB for that long, it does not matter what round he was selected in.
Secondly I took another relatively arbitrary measure (TD/INT ratio) and classed any QB a ‘success’ if their ratio was greater than 1. Throwing more TDs than INTs is a bare minimum for a successful NFL QB, so it does make sense although, as I say, you could choose anything you feel like. I then looked at the total number of QBs picked in each round who class as a ‘success’ on this measure. On this rating, the early rounds have far more ‘successes’ than in the later rounds (as an example, of the 26 first round QB selected between 95-05, 15 of them had a TD/INT ratio greater than 1, compared to only 5 of 25 6th round picks, where 12 of the picks never threw an NFL pass).
My conclusions are that draft order only affects a player’s chance of being an NFL quality QB, but if a player is an NFL quality QB then his career stats will be unrelated to the round he was picked in.
Every study I have looked at has shown that draft order is pretty well correlated to NFL success. And this is, perhaps, slightly more true at the QB position than at other positions. The most interesting thing to me is how it's become some sort of mainstream idea that QBs are gambles in the draft.
One related question: Is a QB drafted by a better team more likely to be successful than one drafted by a bad team? Perhaps a player's success is determined significantly by the quality of the coaches and players that surround him in his early years in the league.
Looking at the start of that first graph, it seems like guys drafted late in the first & 2nd rounds have done noticeably better than the guys drafted earlier in the same round.
@Chase - I think that might be because other positions have fall backs. If Okung doesn't become the 10-year LT everyone expects him to be, maybe he can just slide over to guard or RT and have a good career there. It'd be an expensive option, and not the greatness you were expecting, but at least there's still some value for your money. Corners can become safeties; DLinemen can shift between End, Tackle, or OLB; RB to back-up/platoon RB (Marshawn Lynch); WRs to slot or deep-threat WR, whatever.
If nothing else, most positions can be a bust and become a back-up who plays regularly but is only an average player (Cowboys Bobby Carpenter). QB doesn't have that type of flexibility. It's either the starting QB who plays the whole game, or millions of guaranteed dollars are sitting on the bench for the next four years. Hellooooo, Jamarcus Russell.
Brian:
What happens to your correlation if you simply weight every quarterback equally? This removes the considerable bias you note, that the QBs who succeed get the most playing time. It's not a perfect solution, since it gives a lot of weight to some small samples (perhaps you could exclude those with very few attempts), but it might provide some sense of what the results would look like with the selection bias removed.
Alternatively, you could cap all players at no more than 150% the average number of PA for that bin, or something like that, to reduce influence of the outlier "diamonds."
I think you'd get the answer you were looking for if your output was a career arc.
How did each player do by round selected in their first year. How did each player do by round selected in their second year and so on.
It seems like the obvious way to remove the selection bias is to compare draft position to a counting stat in stead of a rate stat. That way, you can include everyone, including the guys who get cut in training camp.
Brian, why not do the analysis using Expected Points Added in stead of AYPA? My instinct is actually to use the log of EPA.
EPA would be good, but I don't have data except for 2000-2009. Also, EPA and AYPA correlate insanely well over the long term.
By the way, why log of EPA and not straight EPA?
"My conclusions are that draft order only affects a player’s chance of being an NFL quality QB, but if a player is an NFL quality QB then his career stats will be unrelated to the round he was picked in."
That seems about right to me.
One related question: Is a QB drafted by a better team more likely to be successful than one drafted by a bad team?
Imagine if Peyton Manning had spent the last decade on the Detroit Lions.
Seriously, it is very easy to find HoF running backs who played on one very bad team after another -- OJ Simpson's teams averaged 4-10 for his career.
But you won't find any HoF QBs who played on teams anywhere near bad enough to average 4-10 for a career. HoF QBs are "winners" all. The lack of such good QBs on bad teams means one of three things...
1) Bad teams for some unknown reason never draft good QBs, as they do good RBs and good players at other positions, or
2) The QB is so overwhelmingly important and dominating that you can't have a bad team with a good one, no matter how bad the other 52 players are. (In which case even top QBs are grossly underpaid). Or,
3) The QB's personal stats are highly dependent on all the other players on the team, much more so than the fans generally understand, as they think the QB makes the team's stats instead of the team making the QB's stats to the extent they do.
If #3 is true then there's going to be a whole lot of variation in individual QB stats from year-to-year (which there is) leading to regression to the mean in their totals, making it hard to see the difference between them (apart from the strength of their teams) via these stats.
In which case, as the first quote above says.
"By the way, why log of EPA and not straight EPA?"
Because my first instinct was wrong. Straight EPA would be better, for sure. The best fit of the data might be some sort of log curve, but that's neither here nor there.
It's not that I have a problem with AYPA, per se, it's just that using a counting stat gets rid of the whole selection bias issue, which I see as a major issue here.
That said, using EPA does introduce two new problems:
1) How do you measure the EPA of players whose careers began before you have EPA data?
2) How do you measure the EPA of players whose careers aren't over yet?
For the first issue, the obvious answer would be to try to cook up a simple stat that correlates well with EPA. One obvious possibility would be something like:
(Adjusted Net Yards) - (League average ANY/A for that year)*(attempts)
My guess is that that would correlate pretty darn well with EPA.
For the second issue, you could either just ignore future years, or give a conservative estimate of future value, based on typical career arcs.
So, counting stats do create some new complications, but all in all I think it's worth it so that you can include all the guys with really short careers. The data set is pretty sparse already, so including the zeros is actually pretty important IMO.