
 "Fast kickin', low scorin',...and ties--you bet!"
I just returned home to the good ol' USA after a week overseas. Evidently, there is some sort of sporting tournament underway in some other country somewhere. It's confusing because sometimes they call this sport "football," except that it's the same sport my daughter played when she was five. Too funny! Still, it is considered a real sport by some, and so it's my job to suck the fun out of it by creating a Win Probability (WP) model, making you realize there's no chance your favorite team can come back to win.
The model I used is a simple Poisson model, which is the same technique I used for NHL hockey. It looks at how often teams tend to score and how much time is left in the game to calculate the likelihoods of possible outcomes. It adds up the chances for all the possible final scores where the trailing team comes back to win, and that's the WP. The parameters of the model are based on the most recent World Cup tournament in 2006.
The model is relatively rough because it does not consider strategy effects. In other words, if a team is ahead, it may alter its strategy to preserve its lead at the expense of scoring more goals, thus maximizing their chances of winning. And if a team is trailing, it may alter its strategy to bias toward scoring at the expense of possibly giving up a larger lead to its opponent. However significant these effects, they would likely cancel out to a large degree, leaving the ultimate win probabilities close to the idealized estimates in the Poisson model.
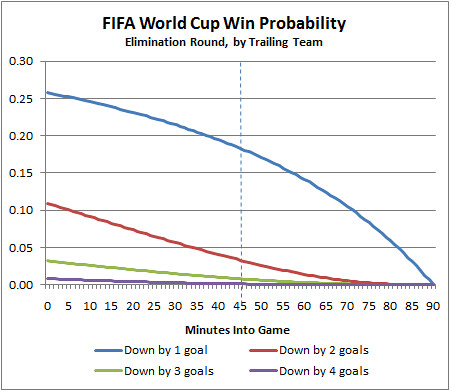
Additionally, the model is generic. A great team that happens to be down by a goal certainly has a better chance of winning than a lousy team down by a goal. Nevertheless, the WP numbers are good guideposts, particularly in the elimination round when team strength is relatively equal.
WP for soccer is slightly more complicated than most other sports because of the ties. In the group round, where teams play a round robin schedule within a 4-team group, ties are allowed (and common). The top 16 teams from group play begin a single-elimination tournament, which does not allow ties. There is also the matter of stoppage. Play continues past the 90-minute mark to account for the time taken for stoppages in play. Only the officials know exactly how much time is really left in the game.
For group round play, here is the WP of the trailing team for winning outright (no tie). For example, at the 30-minute mark (with 60 minutes left to play), a team trailing by one goal would have about a 11% chance of winning outright.


I'll leave you with one of the greatest moments in soccer history, the 1994 Mexico-Portugal classic:


Wonder how close these models are to the historical data... it would be interesting to see how big the "strategy effects" would be, as well as the typical skill gap.
-Adam
Soccer football is just short for association football, yeah? Both games were called football, and in the rest of the world, they decided to call the pigskin game "American Football," and the other one was association football, which they just shortened to football. Here, we called American football "football," and so we shorted the other one to "soc" football, then soccer. As far as I understood it.
Thank you, Brian Phillips.
-Bill
Right, except American football came later. The other version was Rugby football. American football grew out of the rugby version and was known as "gridiron" football.
Brian, do you have any info on the reliability of win predictors with soccer? I've seen the Financial Times website publish a couple. I'm wondering if World Cup wins (and soccer outcomes in general) are more random than other sports. Brazil is favored but really struggled against least-favored North Korea. I think back to underdog Greece winning the Cup a few years ago.
Odd sidenote: When I lived overseas I showed some locals NFL tapes people had sent me. They said "at least in soccer you can tell who is good. In American football, it's much harder to tell who has talent."
JDTapp,
That is odd, but kind of makes sense.
For one thing, I think it's easier to see who's good if everyone's role is more or less equal, and if there's individual competition at play. Soccer is a team sport but there's a lot of one-on-one, like in basketball, so you can see someone clearly getting "beat" and outplayed. You see the same thing in football, like a WR burning a CB, but it's tougher to judge if a WR is better than, say, a QB, since they have completely different roles.
Familiarity with the sport probably has more to do with it, though. Half the time in hockey I can't tell the difference between a brilliant play and a mistake, since I never watch it.
I can only assume that comment comes from unfamiliarity with the game. As a hardcore (American) football fan for more than 25 years, I can easily tell when one player is getting totally worked. It's not uncommon for the announcers on TV to actually point it out and continually harp on it during replays. It's much more difficult in a live game, but I can clearly remember times here in Jacksonville when I watched one player repeatedly get beat by another.
It's interesting that the Probability of tying for a team down by one goal is upward sloping for the first half hour of the match.
Anon,
It is interesting. That also makes some sense though, considering that when a team scores an early goal they will often tend to play "not to lose" rather than play to win... i.e, play a sort of "prevent defense" that will sometimes allow 1 goal, but no more.
There's a much different mentality when you know there's no winner-takes-all OT... Mexico and Uruguay, for instance, could sit around and chat with each other in Spanish for 90 minutes and move on to the next round. Too bad they won't, because it'd probably be more exiting than soccer. I kid...
Thank to you USA's we are now trying to use some serius modeling to try to predict soccer. The mass just using theire insticts and lose millions
It looks during the game from today down 2 48 minutes into the game the US team was at somewhere around 4% to tie and 1.5% to win according to the charts. Which is a very nice comeback, and maybe even better given the relatively low scoring in this year's tourney.
To think the USA was a blown call away from an upset with a 1.5% chance of happening....
USA was only a slight favorite in the game. It would have been less amazing if they were heavy favorites. I wonder how many 2-goal-down comebacks there have been at the WC.
Brian - from Foxsports - Not sure how many there have been but it has been a long time.
"The ref's decision also cost the United States a slice of soccer history; in 80 years, no team had ever rallied from a two-goal deficit to win a World Cup game."
Here is the historical data:
http://www.whowins.com/features/FIFAworldcup2010.html
Can you graph it against your model.
Wow.. My country, Denmark was behind by 1 after 33 minutes (After the biggest mistake in the tourney)(WP=0,10) and won. That's huge. Also, I think the WP is to big for the team ahead. I would think a team in Denmark posistion would have about 15-20% chance of winnig
Martin - although it's not international football, I've spent a lot of time looking at Premiership match data and I would say that Brian numbers are about right.
For instance, teams down by one goal at half time. In the Premiership, home teams down by one at half time win 11.2% of the time, draw 25.4% and lose 63.4%. For away teams it's 6.4%, 18.4% and 75.2%. Because the World Cup is neutral, we can take the average of the home and away figures, giving 8.8%, 21.9% and 69.3%.
This is almost bang on where Brian's numbers go through at half time.
Ian - You might be right, but it's just a gut feeling, that history backs up, apparently. Just look at the comment above mine
By the way: Brian, how do you calculate WP?
Martin - thanks for the point to the data. I missed that. I can't believe just how different that data is to the Premier league data (I can imagine slight difference due to it being country not club, but 9% vs 17% isn't even close). My only thoughts would be that the Premiership data is over the past 5 seasons, whereas that World Cup data goes back to 1930. Given how the game has become lower scoring since then in general, a one goal lead is probably more secure than it once was.
Ian - You are right, Scoring has gone down over the years, but one goal down, and only having 9% chance of winning? That's to low
Well, like I say that's based on real data (just to reiterate, it's from half time not 33 mins in your Denmark game). It comes from over 900 EPL games over the past 6 seasons.
I fully accept that the EPL data may not represent World Cup matches accurately though. You also have to remember that we're talking about generic win probabilities i.e. we're trying to model WP based on knowing only the match score at a certain time.
If you knew absolutely nothing about a game other than a side was 1-0 at half time, and were asked how likely it is that the losing side would win, (in my opinion) 8.5% is as good a guess as you could give.
Being down 1 goal affects your chance of winning in 2 ways.
1) the other team has to score more goals to catch up (obviously)
2) The "better" team is also more likely to score first, so having a first goal (and/or a lead) is going to be an imperfect indicator that you have more skill. Therefore one would expect that the more unequal the skill in a league is, the more safe a 1 goal lead should turn out to be.
How that relates to world cup vs. premiership I don't know... Both are wildly unequal (at least in round robin games... probably less so in WC elimination).
Brian,
Great work. I'm glad to see a win probability model for soccer, and it looks pretty accurate to me. One thing (forgive me if this is a dumb question), but how would you calculate win and tie probability for a game in which the score was level (0-0, 1-1, etc.)?