

Like the previous analysis, I relied on how possession was obtained as an indication of a momentum-swing. For all drives from 1999-2013 ( through week 8), I compared a team's expected chances of winning (based on time, score, field position, down and distance) with how often that team actually won. I divided the data among three categories: possession obtained following a momentous play, possession obtained following a turnover on downs, and possession obtained following a non-momentous play.
Momentous obtainment includes fumble recoveries, interceptions, muffed punts, blocked kicks, and blocked field goals. I excluded missed field goals from the analysis because it was unclear to me how momentous they are. They are often thought of as big momentum changing events in close games but are too common (almost 20% of all kicks) to truly be momentous.
The reason this is such a useful method for testing momentum is because the Win Probability model is a function that estimates a team's chance of winning a game based on a snapshot of the game state, and it is agnostic to all previous events. In other words, the WP model is, by design, completely unaware of how a team got to where they are in a game.
For example, the WP model cannot tell the difference between a game in which Team A started hot with a 14 point lead only to give up 21 unanswered points, and another game in which Team B started the 2nd half behind by 17 points but has closed the lead to only 7. In both cases the team with possession is down by 7, but one team has all the apparent momentum and the other team doesn't.
Because the WP model is ignorant of past events and only the present state, true momentum-swinging events should cause the model to break--if momentum is real, that is. In other words, teams with positive momentum should win more often than the WP model predicts, and teams without momentum should win less often than the WP model predicts. According to the example above, both teams are in identical game states (down by 7 with the ball), and the WP model would expect them to win with equal probability. But Team A, which started hot but lost the momentum, would be expected to win less often than Team B, which started cold but has the momentum.
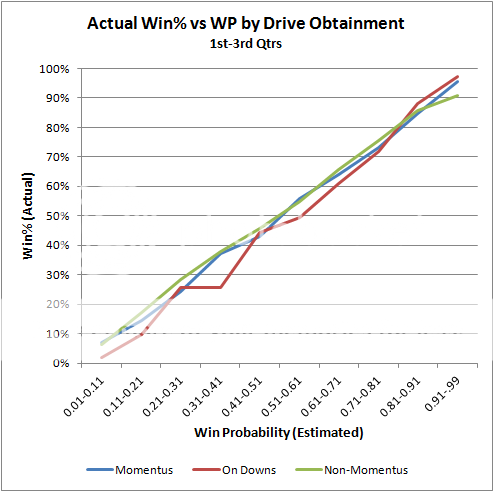
So let's test the accuracy of the WP model following various methods of obtaining the ball. The chart below compares the actual winning percentage of teams according to how the model estimated their probability of winning at the point of obtaining possession. (Ideally, a perfectly calibrated WP model would produce a perfectly diagonal line--When it says teams have a 0.65 probability of winning, they win exactly 65% of the time.) Deviation from the ideal diagonal will indicate the effect of momentum-swinging events on actual game outcomes.
The plot is broken out by how possession was obtained. The blue line represents momentous obtainment. The red line represents obtaining the ball following a turnover on downs, and the green line represents non-momentous obtainment. The idea of momentum suggests the blue and red lines would be above the green line throughout the range of expected WP.

In the chart above, we can see that teams that obtain possession on downs win less often than we would expect given the game state. This is contrary to the expectation based on the momentum hypothesis. There does not appear to be any significant difference between the effects of other momentous and non-momentous events.
The previous article examining momentum excluded all drives that began in the 4th quarter. The purpose of that exclusion was to eliminate situations in which a team with a lead did not need to try to score to seal the win. But in this analysis, the WP accounts for such dynamics and the exclusion is not warranted. However, in the interest of consistency here is the same analysis with 4th quarter drives excluded.
It appears teams that obtain the ball following turnovers, blocks, and muffs do not win any more frequently than teams that obtain the ball by non-momentum-swinging means. And of particular interest, teams that obtain the ball following a failed 4th down conversion attempt do not win any more frequently than those who receive the ball through typical punts and kickoffs.
These results are consistent with the results from the previous drive-level analysis. Momentum-swinging events including turnovers, blocks, and muffs do not appear to inspire a greater level of performance. Indeed, the opposite may be true.
The next installment of my momentum study will get down to brass tacks and look at how the concept of momentum affects in-game decisions. And beyond that, I'll dig deeper into the general notion of momentum in football, applying a novel statistical approach to measure the 'streakiness' of games. The results may be surprising.


I think people have mentioned this earlier in comments, but it seems like the last place momentum can hide is when a team sustains a drive. I think this analysis clearly shows that whenever there is a change of possession there probably isn't any momentum to be carried over. But what a about when one team keeps the ball?
One commenter had the idea to compare subsequent 1st down conversion rates after a team has already obtained a previous 1st down on that drive. This could probably be done more rigorously with expected points.
There are some effects that would have to be weeded out; good teams are more likely to get a first down than the 66% leauge wide conversion rate - so when they go ahead and get that first down, obviously they will continue to convert first downs at their true rate, not the league wide average.
Heres the kicker - even if an effect like this is seen (higher than average 1st down rates), it isn't necessarily "momentum" how we think of it - it could just be an offense exploiting a specific weakness. This would last as long as it takes the defense to recognize and react.
Good example - Colts vs. Saints in the super bowl. Manning and Wayne ran that 5 yard square in like 10 times (almost) in a row. It was automatic, until Porter stepped in front and returned it 70 yards for a touchdown. I wouldn't call those previous completions momentum, it was just the colts exploiting an area of the field that the Saints weren't covering very well...until things changed.
This sounds an awful lot like the "Team Identity" post(s) Brian had last year. Some crap that announcers spew out because they can't give any real analysis. Team A just isn't playing well because Team B is more talented, better coached, or getting lucky. I'd rather have an announcer tell me that than make up momentum or identity crap. Apparently, that's too difficult for most.
One thing that may be working against this analysis (and the first one) is that not all of the events you've labeled "momentus" are actually momentus. For example, suppose the defensive team is winning big, and they intercept a pass. It's hard to argue that play causes momentum for the team that is already winning big. I'd think you'd want to filter those out.
One idea is to define "momentus" plays as those that cause a reasonably large change in winning probability, and then perform the same analysis as above. You'd want to see if large swings in win probability from a single event lead to different "true" win percentages than the average game.
In human performance, as in physics, momentum is conserved until it encounters a force that reduces or negates it. In football, that force can be an external defensive counter, or an offensive strategic failure.
Brian A. - I agree. But it's not a requirement that all of those plays be momentum-swinging' for us to detect momentum. If just some of them are, we'd expect to see some sort of bump in win%.
To eliminate the non-significant 'false' momentous plays, it would be very easy to include only those that take place when the WP is reasonably close to .50. That's when those kinds of plays are high-leverage. Or I can actually use my Leverage Index stat that's been gathering dust for yrs.
Andy- Good points, especially regarding consecutive conversions on drives. I think one of the upcoming posts will address that head on by measuring how 'streaky' games are.
Nice post. Interesting that when only looking at 1st-3rd quarter situations the stop on downs cases appear to drop even farther below the non-momentus cases as compared to looking at all cases. This probably means that when looking at ONLY 4th quarter situations the stop on downs might actually result in higher win probabilities than the non-momentus cases (at least hinting at the possibility of momentum). Wouldnt a stop on downs (theoretically) be more of a momentum swinger in the 4th quarter than during the first three? And wouldnt a (theoretical) momentum swing late in the game have a bigger effect on game outcome than one much earlier where a variety of other factors could wash it out? Id be interested in seeing this graph just for late game scenarios when the win probability is closer to 50/50 (as mentioned in the other posts). Other course there is no evidence of this for any of the other momentum swinging events, so there's that...
p-values!
First, I think this is an interesting set of articles. Brian, you mentioned in your comments an upcoming article on streaks. I have been wondering how to use the change in slope from negative to positive, or vice-versa, as the foundation and definition of momentum. I am looking forward to the next installment.
There is one element which I still have trouble reconciling, if how one gets the ball doesn't matter then only where and when one gets the ball matters. Yet there is a very high correlation between turnovers and winning. Do teams who are already behind turn the ball over more by taking more risk? Is the correlation not as strong as reported?
I don't think this gets put behind us (me) until we (I) know.
The last point is I have a nagging feeling that looking for momentum in game stats is somehow analogous to looking for thoughts in a brain during autopsy. If you use the autopsy results to draw your conclusion, you can conclude thoughts don't reside in the brain, yet we all think they do.
Turnovers and winning are correlated because: (1) turnovers create more drives for your team, resulting in more points for you; (2) turnovers take drives away from the opponent, leading to fewer points for them; and (3) they potentially indicate a general difference in skill between teams.
What Brian is saying with the momentum analysis is that, if a drive begins after a turnover, that drive is no more likely to lead to points than an average drive that begins in the same location.
Since possession alternates, I don't see how an extra possession results. Certainly a shorter one but if the game impact is the same as punt plus return, why the correlation with wins?
Possessions represent an opportunity to score. Don't think of them as drives so much as "nonzero scoring probabilities," where advancing increases the probability to score.
A turnover reduces that probability to zero for the opposing team and creates a nonzero, likely significant probability for you.
I imagine that the relationship between turnovers/wins and punts/wins is in fact not that far apart (or as far apart as narratives would have you believe). If we compared teams by the number of punts they were forced to kick, I doubt we'd end up with a much different narrative (although turnovers do a better job in terms of field position, usually, then punts).