Over the past few months I've been writing about how game theory can help us understand play-calling in football. Not only can it help us understand why coaches call the plays they do, but it can instruct us on what the optimum balance of play types should truly be. Offenses always need a mix of strategies to maximize their gains, no matter how much better they might be at running over passing or vice versa. But just important as the ratio of the strategies is the unpredictability of each call.
The mix of plays needs to be random to be effective. That's not to say play calling should be picked willy-nilly out of a hat. For every situation there will be an optimum ratio of play types. For example, on 3rd and 1 situations, teams should generally run at least about 85% of the time. But within that 85/15 run-pass mix, the decision needs to be unpredictable, which means it must be random and independent of the previous play call. The problem for play callers, and the opportunity for defensive coordinators, is that people are terrible at randomizing.
There's a story about a statistics professor who challenges his class to a contest. He divides the class in half and tells one group to flip a coin 100 times and write the sequence on the board-- THHTTH... The other group is told to invent and write their own sequence of heads and tails on the board as randomly as they can, without looking at the other group's sequence. The professor says that if he can't tell the true random sequence from the fake one, he'll give everyone an A (or something). He leaves the room until both groups are done, then returns and instantly spots the fake sequence. The professor can identify the fake random sequence so easily because it has too many alternations between heads and tails, and too few long streaks. The fake sequence looks like HTTHTHHTHT, while true randomness often looks like HHHHHTHTTH. True randomness can be quite streaky (which is partly why people fall for fallacies like "being in the zone" or "the hot hand").
If I'm a defensive coordinator, I'd like to know what kind of play the offense is going to run. I don't need absolute certainty--any idea is better than no idea. For example, for all 2nd and 10 plays in the NFL, offenses run the ball 46% of the time. But what if defensive coordinators could know that based on other circumstances, this particular 2nd and 1o will be a pass 80% of the time?
Take a look at run-pass balance on 2nd down situations. The graph below shows the percentage of run plays on 2nd downs according to the yards-to-go situation. There is one noticeable aberration at 2nd and 10: runs are far more frequent.
Why would runs be far more frequent on 2nd and 10 yards to go than on 9 or 11 yards to go? The task facing the offense is not meaningfully different. What makes 10 yards to go so special?
The key is that 2nd and 10 situations are several times more likely to occur due to an incomplete pass than due to a run for no gain. This suggests that, effectively, teams are significantly more likely to run following a pass than pass following a pass. Therefore, offenses are not randomizing as much as they are alternating.
Play calls are not independent of the previous plays, even for similar down and distance situations. NFL offenses are therefore substantially, although not completely, predictable.
Instead of HTHHTHTH in a statistics class, we have RPRRPRPR in football. The patterns remind me of a language with consonants and vowels. But play calls are not simple either/or run or pass decisions. There are several variations to each, just like there are a's and e's and b's and c's.
Linear B was an ancient written language found in Crete and named for its straight lines. It was a precursor to the Hellenic Greek language dating back to the times of the Homeric epics. Several tablets with etchings in Linear B were excavated in Knossos, thought to be the capital of King Minos. The script was completely unlike any other, and baffled archeologists for decades. Researchers had nothing to go on except the patterns found in the writing. In the mid-1940s Alice Kolber, an American professor, theorized that the characters represented syllables and that the language was highly inflective (having lots of different conjugations). Then in the 1950s, an amateur archeologist named Michael Ventris cracked the code. He found that each character represented a consonant-vowel combination. Each sound a person can make either goes well with others or it doesn't. This was all that was needed to eventually decode Linear B and unlock all its secrets.
Just like vowels and consonants, runs and passes tend to alternate. And certain types of plays tend to work well before and after others, just like "th" or "rn" or other consonant combinations.
I'm not claiming that we can crack the code on play-calling any more than you can predict my next word. My point is that a serious cryptographic analysis of play-calling could reveal tendencies not previously thought possible. For example, try to predict the next letter of the word "th..." Chances are very good it's a vowel, and if it's not, it's got to be an 'r.'
I'm sure coaches pore over hours of film trying to discern opponent tendencies, and are looking for things I couldn't even fathom. But it seems that they are focusing on situations in isolation. They're zeroing in on observations like, "they run on 2nd and long 35% of the time in the red zone." Apparently, coaches are not picking up on the fact that the same team might run 65% of the time in the same situation following a pass. If they were detecting these patterns, they wouldn't let their own offenses be so predictable.
I realize this is a wondering essay. My main points are that:
I was going to finish this article by retelling an Edgar Allen Poe story in The Purloined Letter. But as I researched the details of the story, I realized I was beaten to the punch by the Smart Football blog. Check out this article on Poe, rock-paper-scissors, and play-calling.
Predictability


Blindsided?
 Michael Lewis, author of the best-selling baseball book Moneyball, recently followed up with a book on innovation in football. The Blind Side follows the story of the left tackle, the player whose job of protecting the more vulnerable side of right-handed quarterbacks has become increasing important in the NFL ‘arms race’ of the pass rush vs. passing offense.
The entirety of Lewis’ premise is based on the relative pay of LTs compared to other positions. Lewis cites the fact that LT has become the second highest paid position, behind only the all-important QB. Unfortunately, the comparison of LT salaries with those of other positions is a false comparison, and a fairer comparison reveals a different story.
I was intrigued by Phil Birnbaum’s response to a write-up of Blind Side at the Freakonomics blog. Phil questioned the justifications for the extremely high salaries for LTs. And although I believe there are sound economic reasons based on the scarcity of qualified players and the contribution of the position, my main concern questioned the premise that LT salaries are truly any higher than other positions.
Like many other positions, offensive tackles are largely ’swappable’ in that they can go from left to right pretty easily. Most backups don’t even have a defined side and are available to fill in on either side to spell a starter or replace him in case of injury.
Due to the 'blind side' consideration, the LT is almost always the better of the two starting tackles on each NFL team. And he’s very likely to make a lot more money than the lesser player who is assigned RT. Starting LTs are basically a group of the #1 offensive tackles from each of the 32 teams.
So when we compare average salaries of LTs to those of say, left corner back or all starting wide receivers, the comparison is not fair. Those positions do not place the better player on a certain side, or they are not defined as left/right positions to begin with. And if a player does always line up on one side, it’s not always the same side for every team.
If we compared the average salaries of LTs to the average salaries of all the best WRs from each team, we might expect to see drastically different results.
A much fairer comparison of position salaries is to compare the average salary of the 32 top paid offensive tackles, whether left or right, with the top 32 salaries of players at WR, CB, or various other positions. So that’s what I did.
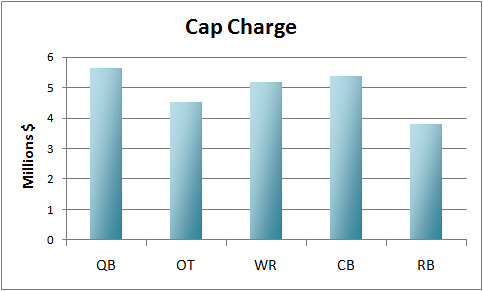
I looked at the average of the top 32 salaries of 2007 at OT, QB, WR, CB, and RB. Because a player’s salary is a convoluted mix of regular salary, signing bonuses and other bonuses, I favor salary cap charges as the best measure of salary. A cap charge is basically a player’s base salary plus an amortized amount of bonus salary. I think it’s the best measure because it most realistically reflects the value of the player to the team. Total salary and base salary, the only other plausible measures, can be highly irregular based on the particular timing of bonuses. However, I’ll include all three types of salary below the graph, and you can judge for yourself.
The graph and table below list the salaries in $millions for the 32 highest paid players at various positions. QB OT WR CB RB Base Salary 2.9 2.3 3.5 3.3 1.8 Total Salary 5.8 4.9 5.7 5.7 4.9 Cap Charge 5.6 4.5 5.2 5.4 3.8
The 32 highest paid offensive tackles, whether left or right, rank only 4th out of 5 in all three measures of salary. I haven’t looked at other positions yet, so there may be others that are higher paid than OT. Further, only 33 of the 100 top paid offensive linemen were tackles, left or right.
While I agree LT is a critically important position and should be highly paid, the comparison of salaries against other left/right positions, or non-“sided” positions is severely biased. A fairer comparison reveals that the top players at other positions are paid even higher salaries.
Are Coaches Aggressive Enough on 2nd and 1?
 In a recent post we saw that having 2nd down and 1 is actually preferable to a 10-yard gain for a 1st down. So if 2nd and 1 is really that valuable, are NFL offenses taking advantage when they get one? Are they actually taking shots down the field? The advantage is only as big as offenses make it. This post will look at how coaches exploit the 2nd and 1 situation.
Coaches are calling run plays on 78% of 2nd and 1 situations, which is even more than the 76% share for 3rd and 1s. For all 2nd down situations, runs are called 50% of the time. This indicates that no, coaches are not capitalizing on the opportunity and are treating the 2nd and 1 simply like an extra 3rd down.
Only 4% of 2nd and 1 plays are long pass attempts, defined as passes at least 15 yards down through the air. This is fewer than nearly all other 2nd down situations (only 2nd and 4 has fewer deep attempts). The remaining 18% are "short" pass plays, but those could be as long as 14 yards. It's these short passes that have generated most of the tactical advantage that makes 2nd and 1 preferable to a fresh 1st down. The chart below lists each play type and their associated expected points, the number of each type and the percentage. Run Short Pass Deep Pass Exp Pts 1.9 2.2 2.2? Count 231 54 13* Share 78% 18% 4%
Because there were only 13 deep pass attempts in the entire data set, I had to estimate their expected points from a larger set of plays. I grouped the deep passes on 2nd down and 1 through 4 yards to go. The resulting average expected points was 1.9, however, the expected points for 2nd and 1 would be higher. If unsuccessful, having a 3rd and 1 is far preferable to a 3rd and 2, 3, or 4 by a weighted average of 0.5 expected points. Deep passes are successful an average of 35% of the time, so this difference would be realized 65% of the time. This equates to a bonus of at least 0.3 expected points.
This suggests that the advantage in scoring from having a 2nd and 1 exists almost purely from the inherent nature of the 2nd and 1, and not due to coaches' deliberate efforts to capitalize on the opportunity. Imagine how large the advantage could be if coaches exploited it with more passes--short or long.
Although it would be hard (or impossible) to convince players to refrain from that second effort plunge at the 1st down marker, it may be easier selling coaches on taking greater advantage of the 2nd and 1 when they do come along.
The Vikings' 2-Point Attempt
 With just over 14 minutes remaining in their game against the Packers, the Vikings scored a touchdown to make the score 17-12. Head coach Brad Childress elected to go for the 2-point conversion attempt. Down by 5 at that point, a 2-point conversion would put the Vikings within a field goal. At first glance, it makes sense. But was this a good decision? And how would we know anyway?
I think the best way to judge a decision like this is to use win probability. Essentially, WP is the probability a team will win a game given the current state of the game. We can compare the WPs for a team down by 5, 4 and 3 according to the likelihood of the outcomes of each extra point conversion option.
First, let's look at the conversion probabilities. Extra point kicks are good 99% of the time, and 2-point conversions are successful 44% of the time.
Second, lets look at the WP for the potential score differences at about 14 minutes left in the game. A team down by 5 has a 17% chance of winning, a team down by 4 has a 19% chance, and a team down by 3 has a 20% chance.
Combining the probabilities gives us the following probabilities of winning:
Kicking the extra point:
= (0.99 * 0.19) + (0.01 * 0.17)
= 0.19
Going for the 2-point attempt:
= (0.44 * 0.20) + (0.56 * 0.17)
=0.18
So it's approximately a wash. The Vikings would have a 19% chance of winning by kicking the extra point and an 18% chance of winning by going for the 2-point conversion.
Childress' decision seemed unusual. It's not that I'd expect him to do the math, but NFL coaches typically will only make the less-conventional decision when the odds are painfully obvious. Why would he make that decision without much to gain?
My theory is that he was tempted by the lure of the 3-point deficit. Field goals are obviously easier to come by than touchdowns, so we could say he was playing for the tie. I think he overestimated the chance of winning when being down by 3. Even if the Vikings were able to tie up the game with a field goal and go into overtime, they'd still only have a 50% chance of winning.
NFL Team Finally Gets It
Long-time reader JTapp sent me this today. Maybe Fred Taylor and Jack Del Rio have been reading too much Taleb.
Pre-Game Coin Toss Makes Jacksonville Jaguars Realize Randomness Of Life
2nd Down and 1
 Al Michaels: “First and 10 from the 30. Campbell back to pass…it’s a screen to Portis. Right sideline…a 9-yard, no make that a 10 yard gain with the spot. It’ll be 1st and 10 for the Redskins at the 40.”
John Madden: “Yeah, Al. That’s just a totally Portis thing. He just knows where the first down marker is by instinct. See, right here [during the replay], he just --BAM!—reaches across the line for the first down. It’s like he’s got radar, Al.”
Actually, in a strange way, 'Sherriff Gonna Getcha' may have just unwittingly cost his team almost a point.
Portis may have cost his team almost a point (on average) because he passed up the juiciest down-and-distance situation of all: the 2nd and 1.
It must give defensive coordinators across the league nightmares. An offense can do anything on 2nd and 1. It can run, and probably pick up the first down, but they could just as easily take a shot down the field without much risk. The QB has the luxury of a no-pressure down. He doesn't have any need to force the pass and can throw it away if needed. An incompletion still leaves a very manageable 3rd and 1. And failing that, an attempt on 4th and 1 may not be out of the question (especially if it's a short 1).
A look at the expected points for 1st and 10 situations shows there is statistical evidence that a 9 yard gain is actually preferable than a 10-yard gain. The graph below shows the average expected points for most 1st and 10 plays in the 1st half of all regular season games from 2000 to 2007. (I excluded plays inside field goal range (the 35) and plays within 2 minutes of halftime. This limits the data to normal football situations, when teams are neither desperate nor nursing big leads, and when time is not a consideration. It also removes any bias in the data due to having the option to play very conservatively inside FG range.)
We can see a fairly clear drop in expected points from a 9-yard gain to a 10-yard gain from 2.3 points to 1.6. That's about a 0.7-point drop in the average number of points scored between having a 2nd and 1, and actually getting the first down. It may not sound like a lot of points, but it's a relatively large difference for a single yard on a single play.
There is, however, some noise in the data. So how can we be sure that the sudden discontinuity between 9- and 10-yard gains isn't just a very large random blip? First, the blip is fairly large. In fact, it's the largest jump between any two yardage gains. Second, it goes in the opposite direction we'd expect it to go. Further, the graph indicates that on 1st down, a 9-yard gain is not only better than a 10-yard gain, but it's better than anything up to a 16-yard gain. It also indicates that a 2nd and 3 is notionally just as good as converting 1st and 10. Lastly, we have a good theoretical basis as to why we'd see such a result.
So am I actually suggesting that ball carriers should intentionally try for a 9-yard gain instead of try for the extra 1 or 2 yards? It might be a hard sell, but yes, the evidence is there. On the other hand, the first time anyone actually did it intentionally, and his team failed to convert the 1st down, the criticism would be merciless and it would never be done again.
However, it appears that it may already be happening, at least unintentionally. The graph below plots the frequency of each gain (or loss) from a 1st and 10. Notice the the divot at exactly 10 yards. There is an unnaturally low number of 10-yard gains compared to 9- and 11-yard gains. This could be due to how refs spot the ball or how defenses guard the 10-yard marker, but it's intriguing.
So if 2nd and 1 is really that valuable, are NFL offenses taking advantage when they get one? Are they actually taking shots down the field? After all, the advantage is only as big as offenses make it. Perhaps it could be even larger if coaches properly exploited the situation. I'll take a look at that in the next post.
Edit: I hope no one thinks I'm suggesting untouched ball carriers should spontaneously drop after 9 yards. I'm only suggesting that the outstretched arm/second effort thing can be strangely counterproductive. But mostly I'm just illustrating how the rules of football sometimes create counter-intuitive effects.


Play Calling on 3rd and Short Part 3
 In this third and final installment looking at play calling on third down, I'll analyze the statistical relationship between individual team's tendencies and their conversion rate. So far, in part 1 and part 2, we've seen that running on 3rd and short tends to get more first downs and leads to scoring more points. So, are individual teams that tend to run on third and short more successful than teams that tend to pass?
A Case Study
One of the notable differences between Patriots’ coach Bill Belichick and most other coaches is his tendency to run on 3rd and short. I cannot recall where I read that, and I’ve wanted to examine 1—if its true, and 2—how it affects his team’s success on third down.
First, yes, it is true. In his tenure with the Patriots, Belichick has run 80% of the time on 3rd and 1 compared to a league-wide average of 70%. This rate makes the Pats tied for 3rd in the NFL for run tendency in that time frame. Their overall conversion rate for all 3rd down and 1 situations was 5th in the league at 72%. So Belichick’s reputation is at least partially true. His teams are near the top of the league in both categories, but not at the very top.
But what about the rest of the teams? If there is a statistical link between run tendency and conversion rate across the NFL, this would be confirmation that teams should run more often on 3rd and short.
The correlation between percentage of run attempts and conversion rate on 3rd and 1 situations is 0.19 (which is statistically significant at p<0.01, n=254.) This seems pretty big considering all the factors that go into conversion rate—team strength, opponent strength, luck. Simply calling more run plays would significantly improve most teams’ conversion rates on 3rd and short. The effect may be somewhat overstated, however. Not all 3rd and 1s are equal. Both 3rd and 1 inch, and 3rd and 1½ yards are considered ‘3rd and 1’ according to the NFL. So teams that have a disproportionate number of 3rd and 1 inch situations would logically run more often, and more successfully. But any bias in the correlation would likely be very small as there are over 28,000 3rd and 1 plays in the data set, and any effect should even out among teams. Additionally, 3rd and 2 and 3rd and 3 situations do not exhibit that complication, but the evidence that teams pass too often is just as strong if not stronger.
The total of all the evidence makes the conclusion clear. Offenses should run more often on 3rd and short. Based on conversion rate, expected points, and team-by-team correlation, running more often on third and short leads to more 1st downs, more points, and consequently more wins.
Play Calling on 3rd and Short Part 2
 Are NFL coaches calling the right plays on 3rd down and short? In part 1, we saw that 3rd down conversion rates suggested teams should run more often in such situations, as long as getting a first down is the only goal. In this installment, I'll continue the analysis by considering two other factors--average yardage gained and expected points.
Adjusted Gain
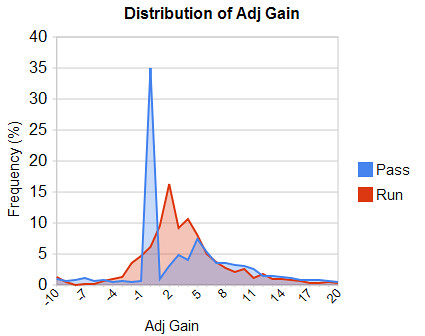
Although conversion rates indicate teams pass too often, they're not the only measure of success on 3rd down. It’s always better to have a 1st down and more yards (except on 3rd and goal). So on one hand, passing seems to offer an advantage over running in that its average gain is longer. On the other hand, there is the chance of an interception when passing. To include both considerations in the analysis, I’ve calculated the “adjusted gain” of each play. Adjusted gain subtracts 45 yards for each interception. This method accounts for interception risk well because a 45 yard loss results in roughly the same change in expected scoring as a turnover. The graph below plots the distribution of adjusted gain for 3rd and 1 situations.
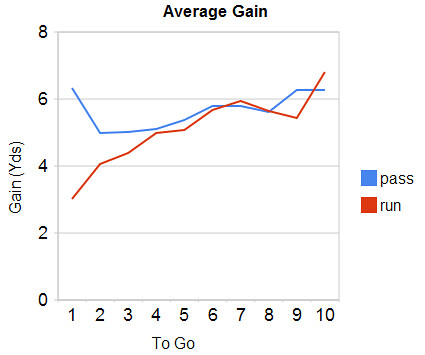
A simpler way of looking at each option is the average adjusted gain for each type of play. Here is a graph of average adjusted gain for 3rd down situations.
Until 3rd and 4 offenses are getting more adjusted yards by passing than by running. By 4 yards to go, adjusted gain equalizes. (Again, except for 3rd and short, it’s striking just how equal the adjusted gains are.) On 3rd and 1 the pass outgains the run by 3.3 yards per play, but the run gets a first down more often. The question now becomes, what would an offense rather have: an extra 12% probability of conversion by running, or an extra 3.3 yards on average by passing?
Expected Points
By comparing the expected points of both options, we can get an answer. A typical punt results in a loss of about 1.8 expected points. This is 12% more likely when passing than when running, which results in a 0.12 * 1.8 = 0.22 loss in expected points. An extra 3.3 yards is worth 0.10 additional expected points. The net difference is 0.12 points in favor of the run. So for 3rd and 1, the extra gain achieved by passing is not worth the added risk of the failing to convert.
The 0.10 expected points from passing’s added gain would be worth it only when running is successful 5.5% more often than passing. This would be the true Nash equilibrium for 3rd and 1.
x = 0.10/1.8
x = 0.055 = 5.5%
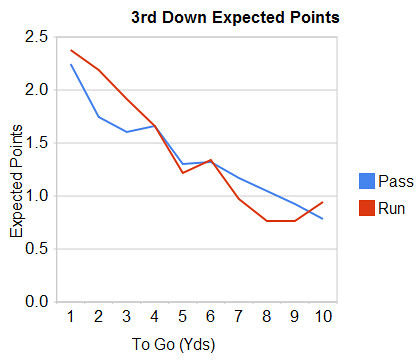
But after I did that little algrebra exercise, I realized it was unnecessary because I already have the historical data for actual expected points for each situation. The graph below shows how many points, on average, a team scored following a 3rd down. Expected points after a run or pass shows that offenses pass too often on 3rd and short and run too often on 3rd and long.
On 3rd and 1, offenses scored an average of 2.38 points if they ran, and an average of 2.24 points if they passed. The difference of 0.14 points is remarkably close to the 0.12-point theoretical estimate calculated above.
The differences are even bigger for 3rd and 2 and 3rd and 3 situations. The advantage of running is 0.45 and 0.31 expected points respectively—convincing evidence that offenses should be running more often on 3rd and short. The graph also indicates passing is ultimately more fruitful on 3rd and long, despite equal conversion rates.
In the third and final part of this article, I'll look at whether teams that run more often on third and short really are more successful. I'll also quantify just how important optimum play calling can be.