
 NFL team efficiency rankings are back for 2008. The ratings are listed below in terms of generic win probability. The GWP is the probability a team would beat the league average team at a neutral site. Each team's opponent's average GWP is also listed, which can be considered to-date strength of schedule, and all ratings include adjustments for opponent strength.
Offensive rank (ORANK) is based on offensive generic win probability is based on each team's offensive efficiency stats only. In other words, it's the team's GWP assuming it had a league-average defense. DRANK is is a team's generic win probability rank assuming it had a league-average offense.
GWP is based on a logistic regression model applied to current team stats. The model includes offensive and defensive passing and running efficiency, offensive turnover rates, and team penalty rates. A full explanation of the methodology can be found here. This year, however, I've made one important change based on research that strongly indicates that defensive interception rates are highly random and not consistent throughout the year. Accordingly, I've removed them from the model and updated the weights of the remaining stats. RANK TEAM LAST WK GWP Opp GWP ORANK DRANK 1 
1 0.86 0.70 1 4 2 
3 0.84 0.42 2 3 3 
2 0.79 0.64 4 13 4 
5 0.76 0.61 6 7 5 
4 0.75 0.54 5 1 6 
18 0.74 0.61 8 20 7 
6 0.70 0.49 3 11 8 
8 0.68 0.64 10 17 9 
12 0.67 0.52 9 2 10 
14 0.64 0.64 20 10 11 
15 0.59 0.50 7 28 12 
9 0.58 0.41 23 14 13 
7 0.58 0.58 13 15 14 
13 0.57 0.42 17 5 15 
10 0.56 0.55 14 12 16 
16 0.52 0.54 22 16 17 
19 0.52 0.55 16 9 18 
11 0.51 0.40 24 8 19 
20 0.50 0.39 11 24 20 
21 0.47 0.49 12 22 21 
23 0.44 0.39 25 6 22 
27 0.44 0.49 27 23 23 
26 0.42 0.48 18 19 24 
17 0.41 0.41 30 18 25 
22 0.39 0.52 15 27 26 
25 0.38 0.50 19 26 27 
24 0.33 0.53 26 31 28 
29 0.29 0.54 28 21 29 
28 0.27 0.63 21 30 30 
30 0.20 0.57 32 29 31 
31 0.16 0.50 29 25 32 
32 0.13 0.51 31 32
To give everyone an insight into why the rankings are what they are, here are the team efficiency stats.TEAM OPASS ORUN OINTRATE OFUMRATE DPASS DRUN DINTRATE PENRATE ARI 7.1 3.3 0.022 0.025 6.5 4.1 0.021 0.36 ATL 5.9 5.5 0.023 0.004 6.3 4.6 0.030 0.34 BAL 4.9 3.8 0.038 0.022 4.1 2.8 0.060 0.55 BUF 6.7 3.7 0.021 0.028 5.3 4.0 0.018 0.25 CAR 6.9 3.8 0.014 0.020 4.6 3.8 0.019 0.50 CHI 6.2 3.8 0.026 0.018 4.9 3.7 0.028 0.39 CIN 4.5 3.3 0.043 0.035 5.9 4.5 0.014 0.37 CLE 4.0 3.5 0.051 0.024 6.7 4.1 0.057 0.52 DAL 8.0 5.0 0.031 0.032 5.7 3.9 0.006 0.51 DEN 7.6 4.5 0.021 0.023 7.1 5.2 0.012 0.28 DET 4.7 4.4 0.047 0.024 8.9 5.0 0.000 0.35 GB 6.8 4.0 0.024 0.034 5.7 5.1 0.054 0.66 HOU 5.7 4.4 0.042 0.039 6.8 4.5 0.018 0.15 IND 6.1 3.6 0.032 0.006 6.2 4.9 0.020 0.31 JAX 5.4 4.0 0.027 0.008 7.1 4.2 0.031 0.41 KC 3.8 4.6 0.049 0.030 7.6 5.0 0.022 0.23 MIA 6.5 4.3 0.008 0.019 6.7 3.3 0.009 0.30 MIN 5.3 4.1 0.018 0.024 6.3 2.8 0.023 0.41 NE 5.5 3.7 0.025 0.018 6.1 4.9 0.047 0.22 NO 8.2 3.2 0.031 0.038 6.3 4.5 0.022 0.60 NYG 7.2 5.8 0.008 0.009 4.4 3.7 0.016 0.48 NYJ 6.4 3.8 0.039 0.021 6.6 3.1 0.034 0.34 OAK 5.6 4.8 0.010 0.041 6.1 4.0 0.039 0.50 PHI 6.7 3.5 0.016 0.020 5.6 3.3 0.026 0.34 PIT 5.8 3.7 0.022 0.029 4.5 2.8 0.036 0.49 SD 7.8 3.8 0.029 0.014 6.1 4.4 0.025 0.27 SF 6.2 4.6 0.043 0.032 6.1 3.8 0.043 0.34 SEA 4.7 4.7 0.032 0.010 7.2 4.6 0.008 0.38 STL 4.8 4.0 0.025 0.030 8.2 4.7 0.009 0.43 TB 5.1 5.3 0.039 0.008 6.2 3.7 0.048 0.49 TEN 6.0 3.6 0.036 0.020 4.6 3.7 0.059 0.37 WAS 6.3 4.4 0.000 0.000 6.0 4.1 0.029 0.30 AVG 6.0 4.1 0.028 0.022 6.1 4.1 0.028 0.39
Week 5 Efficiency Rankings

Reggie Bush vs. Gus Frerotte
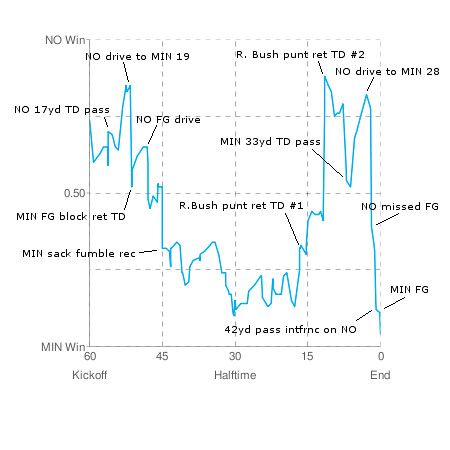
 Wow, another cardiac arrest of a game Monday night. Here's how it unfolded in terms of win probability. Reggie Bush almost single-handedly won the game for the Saints, responsible for two touchdown returns and another return into Minnesota territory leading to a field goal. At one point New Orleans was up 27-20 with less than 10 minutes remaining in the game. But Gus Frerotte was able to make some incredible passes down the stretch. Gramatica's missed field goal in the 4th quarter was the real back-breaker. Not only did it waste a solid New Orleans drive, but it gave the ball to the Vikings in good field position with just enough time to score and not enough time for the Saints to respond. But the 42-yard pass interference by New Orleans defender Kaesviharn in Minnesota's game-winning drive sure didn't help.
PIT-JAX in Win Probabilities
 As I'm testing out my new win probability toy, there are lots of fun things to do. Here is a timeline of Sunday night's game between the Steelers and Jaguars. The Steelers got out of town with the W, but late in the 4th quarter it was Jacksonville's game to lose. The wild swings in win probability made for a fun game to watch. Check in tonight for the MIN-NO game's WP graph to be updated live.

In-Game Win Probabilities Beta 0.2
 I'm testing a real-time win probability site again this week. The current state of each ongoing game will be reported along with the probability of winning for each team. The probabilities are based on over 2000 games from the past 8 regular seasons. Last week, the model was fairly basic and simply considered score, time, and possession. This week modifications for field position and seconds are included. You can think of each probability as "if the team with the ball had a first down at their current field position, this would be their chance of winning."
Next week, I hope to include down and distance to go. I'm also planning to include a timeline graph of each game's win probabilities.
Readers of this site are invited to check out the beta version during the games today. Be warned there will certainly be hiccups, bugs, and other problems throughout the day. So if it's not working one minute, it may be back up the next. It goes live shortly after the 1 o'clock kickoffs today. Comments and suggestions are more than welcome!
The link is wp.advancednflstats.com.
Week 5 Game Probabilities
 Win probabilities for week 5 NFL games are listed below. The probabilities are based on an efficiency win model explained here and here with some modifications. The model considers offensive and defensive efficiency stats including running, passing, sacks, turnover rates, and penalty rates. Team stats are adjusted for previous opponent strength.
Last week the predictions were 10-3. But if you are a new reader, don't expect the model to be that accurate every week. On average it will be between 70-75% correct, and some weeks it can go 6-8. Over the past 2 seasons however, it's been the most accurate prediction system I can find, but only slightly more accurate at picking winners than the spread.P WIN GAME P WIN 0.15 0.85 0.79 0.21 0.53 0.47 0.68 0.32 0.15 0.85 0.56 0.44 0.59 0.41 0.54 0.46 0.31 0.69 0.42 0.58 0.28 0.72 0.12 0.88 0.47 0.53 0.30 0.70