
 In another guest post at the NY Times Fifth Down blog, I took a look at what a Pro-Bowl caliber quarterback can be worth. Specifically, I estimated how many wins a passing game with Cutler's 2008 numbers could typically be expected to add to a new team.
Cutler's Potential in Chicago
published on 7/26/2009
with
2
comments

Jay Cutler's Interceptions in Context
 In my third installment this week at the Fifth Down Blog, I discuss Jay Cutler's interceptions. Although he threw 18 picks, the second most in the league in 2008, that number is very deceiving.
If you missed the second installment yesterday, don't worry. It was a rerun of my 'Vick is Underrated' article from a few weeks ago.
published on 7/24/2009
with
4
comments
Guest Post at the NY Times 'Fifth Down'
 I'm a guest contributor for the New York Times Fifth Down blog over the next few days. There will be some fresh articles and some older articles updated with new data. Today's post is a look at just how bad pre-season predictions tend to be.
My thanks to Toni Monkovic for the invitation.
published on 7/22/2009
with
2
comments
Michael Turner in 2009
 One of the more popular articles here over the past year or so has been the 'Myth of 370' article that debunked the direct connection between very high carries one season and significant decline the following season. Atlanta running back Michael Turner is at the center of the discussion this year, at least in terms of fantasy production. He had 376 carries in a breakout season, so naturally fans are wondering what to expect from him in 2009.
Judging by some of the discussion out there, I'm worried some people misunderstand what the Myth of 370 article says. What it does not say is that Michael Turner can be counted on this year to match his 17 TDs and 106 yds per game from 2008. In fact, history suggests he won't repeat. What the article does say is that a RB's tendency to decline after a career year is not due to overuse the previous year.
For a RB to have a career year, a lot of things come together all at once. By definition, he's healthy himself. Plus, he's usually at his peak athletically, he has a talented and healthy offensive line, and his opponents tend to be weak at defending the run. Should we expect the stars to align the same way in following year?
Of course not. Linemen come and go or get hurt, opponents change, and lots of other factors change. Chances are most of those factors aren't going to get better, but get worse. This natural process is at the heart of the concept of regression to the mean. To see what I mean, look at the two following graphs based on top RB performances from 2001 through 2008.
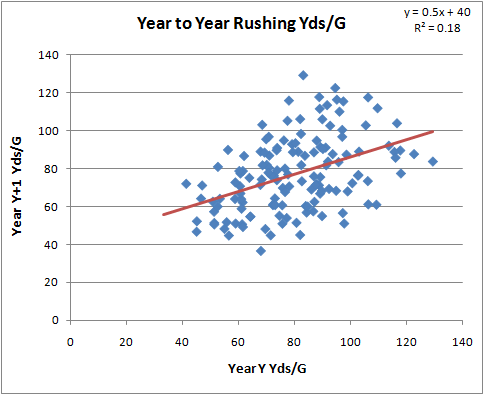
The first graph plots RB rushing TDs per game from one year vs. his rushing TDs per game from the following year. A regression line is fit to the data, showing us what we can typically expect from one year to the next. For example, Michael Turner's 1.1 TDs/G from 2008 would typically suggest a 0.8 TD/G output in 2009.
The same effect is present in rushing yards. Turner's 106 Yds/G from 2008 can be expected to tend towards about 85 Yds/G in 2009.
These graphs are presented in terms of 'per game.' Total production is therefore heavily dependent on how many games a player appears in. The top RBs from one year (regardless of the number of carries) tend to play in only 13 out of 16 games the following year. This should also temper anyone's enthusiasm for a repeat year from Michael Turner.
However...these regression effects apply to all RBs, not just Turner. So you shouldn't avoid Turner any more or less than any other top RB in your fantasy draft. Plus, the regression only explains a fraction of the following year's performance. Turner could score 30 TDs or he could score zero. It's all a crap shoot, and I'm only discussing tendencies.
More on regression to the mean and: wide receivers / coaches / turnovers.

published on 7/20/2009
with
3
comments
New Baseball Tracking System
Imagine this adapted for football. It's only a matter of time. Check out the video in the article.
Hat tip--TSE.
published on 7/16/2009
with
0
comments
Lucky/Unlucky Baseball Teams
Fangraphs.com, which is best described as the baseball version of this site (actually, the other way around) posted an article today about the luckiest and unluckiest MLB teams at the all-star break.
It's very similar to my own lucky/unlucky breakdown. They're using a simpler runs for/runs against Pythagorean model while I use a logistic regression of efficiency stats. Both systems adjust for opponent strength. I think both are appropriate for the different characteristics of the two sports.
published on 7/14/2009
with
0
comments
In-Game Home Field Advantage
 Last season I discovered something interesting about home field advantage (HFA) in NFL games. It decreases as the game goes on. In terms of points scored by quarter, home teams have the biggest advantage in the 1st quarter, and then their advantage disappears by the end of the game. By the end of regulation, home teams and visiting teams perform equally well.
Although it’s clear that home teams perform better during a game, at least in terms of points scored, it’s not clear exactly how this translates into an increased chance of winning minute by minute. From simple win-loss records, all we know that at the outset of a game the home generally team ultimately has about a 56.5% chance of winning.
So there are (at least) two mechanisms at work. First is the decrease in performance advantage for the home team as the game goes on that I discussed above. Perhaps fatigue neutralizes the home team's edge, or perhaps it's visitor acclimation to a hostile, unfamiliar environment. Second, as the game clock ticks down, there is less time for the home team to capitalize on its advantage. By the end of the game the scoreboard doesn’t care which team is the home team and which is the visitor. A 1-point lead is good enough to win, period. So it’s a complicated thing to model. We just can’t add 6.5% to the win probability (WP) for the home team throughout the game.
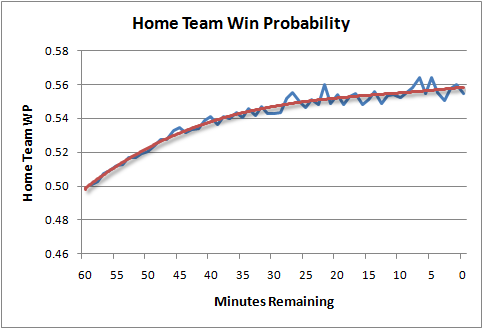
But I think I’ve cracked it. Using the WP model, which does not consider HFA, I can chart the average probability that the home team will win as the game goes on. It begins at 50% and by the end of the game it’s 56.5% (which I'll call a "6.5%" advantage).
But we know that 6.5% advantage really exists as early as the first kickoff. It’s just that the model is “learning” and discovering that advantage as it actually accrues over the course of the game. So the shape of that curve is the shape of the curve of actual HFA, just in reverse.
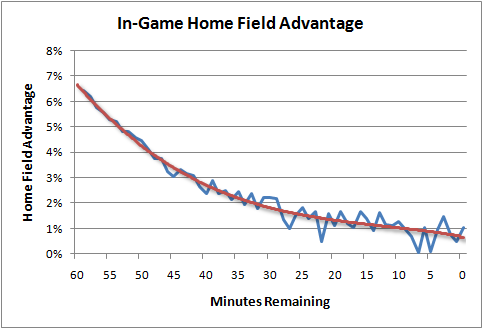
Starting with a 6.5% advantage at kickoff, and following the shape of the curve, we see the real, no kidding, actual HFA as the game goes on. This isn’t HFA in terms of yards per play, first downs, or points scored, or in terms of anything except the probability of winning.
The HFA equation is:%HFA = (-4E-05)t3 + 0.0056t2 - 0.304t + 6.98
Where t is the time in minutes remaining in a game.
This now enables me to feed the strength of the advantage back into the win probability model to properly adjust for HFA. I would have to adjust the home field-agnostic WP with these values logistically (using the log of the odds ratios). This is because HFA would decrease in importance as one team or the other builds a large lead. HFA doesn’t really matter if a team has a 28-0 lead at halftime.
I've intended to include HFA into the WP model for a while, but just didn't know exactly how it declined through the course of the game. Now I know. Thanks to Ian for an insightful comment that got my wheels turning.
published on 7/13/2009
with
14
comments
Win Probability Model Accuracy
 Occasionally I see comments asking about the win probability model's accuracy. The model and the game graphs it creates are useful and entertaining, but only if they're accurate. How do you know I'm not just making up a bunch of nonsense?
For readers who are accustomed to linear regression models, you'd expect to see a goodness-of-fit statistic known as r-squared. And for those familiar with logistic models, you'd expect to see some other measure, such as the percent of cases predicted correctly. But the win probability model I've built is a complex custom-built model, using multiple smoothing and estimation methods. There isn't a handy goodness-of-fit statistic to cite.
We can still test how accurate the model is by measuring the proportion of observations that correctly favor the ultimate winner. For example, if model says the home team has a 0.80 WP, and they go on to win, then the model would be "correct."
But it's not that simple. I don't want the model to be correct 100% of the time when it says a team has a 0.80 WP. I want it to be wrong sometimes. Specifically, in this case I'd want it to be wrong 20% of the time. If so, that's a good feature of any probability model. This is what's known as model calibration.
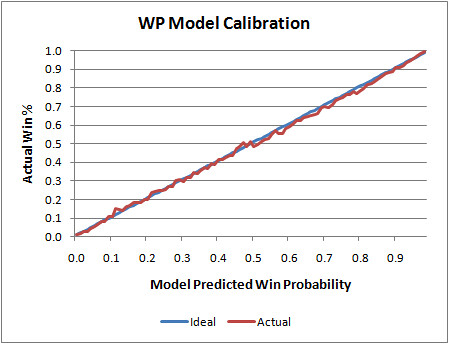
The graph below illustrates my WP model's calibration. The blue line is what would be the ideal calibration, and the red line is the actual. As you can see, it's nearly perfect. Whenever the model says a team as a 0.25 WP, it goes on to win 25% of the time. And when it says a team has a 0.35 WP, it goes on to win 35% of the time, and so on.
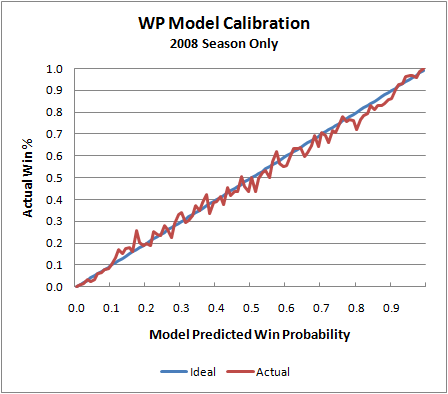
That graph is slightly deceptive, however. The model is essentially "predicting the past." In other words, it's using the same game data it was originally built on to test itself. (There is so much data in the sample, I doubt this is really an issue.) Actually, the model is based on data from the 2000 through 2007 seasons. So here is the model applied to the 2008 season, which was not included in the 'training data.'
We see the same tight symmetry, which is what we're looking for. Of course, there is naturally more noise because of the smaller sample, but that's completely expected. I do notice that the actual values 'sag' a little toward the upper end of the scale. This may suggest that the model is very slightly (but possibly systematically) undervaluing possession when teams have large leads early in a game or small leads late in a game. That's something worth investigating.
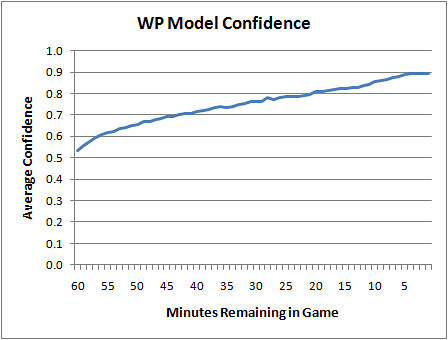
But calibration is only half the story. Consider a WP model that always said each opponent had a 0.50 WP no matter what the score was. Technically, it would be perfectly calibrated. It would end up being correct exactly 50% of the time. So aside from calibration, we'd want a model to be confident. If a model possessed God-like omniscience, it would have 100% confidence as soon as kickoff. Obviously, we can't do that (even for games against the Lions). But as long as the calibration is sound, the higher the model's confidence the better.
Here is a plot of the WP model's confidence by game minutes left. At kickoff, it's a 50/50 proposition, and then as the game unfolds it becomes clearer who has the upper hand. Even in the final minute, it's not totally clear which team will win, and that's part of what's great about the NFL.
Needless to say, I'm very pleased with these results. But this isn't a testament to clever modeling or brilliant research. It's simply due to the wealth of data I started with. Even so, I'm currently working on major improvements that I hope will be ready for the upcoming season.
published on 7/07/2009
with
8
comments
Subscribe to:
Posts (Atom)