
 Being a Ravens fan makes me appreciate exciting defense. Most football fans are more interested in touchdown passes and long runs, but I've learned to enjoy interceptions, sacks, and safeties. Measuring the values of interceptions and safeties are relatively straight-forward. But sacks come in all shapes and sizes. In my continuing series on things that might only interest me, I'll look at a couple different ways that sacks can be valued. (Hat tip--Buzz)
A sack on 4th and 5 with the game on the line late in the 4th quarter is obviously far more valuable than one on 1st and 10 in the 1st quarter. But players can't control when their sacks, or any other types of plays, come. Otherwise, they'd save up all their best plays for when they matter the most. So I'm not going to worry about all the situational variables. I'll start by looking at sacks in the aggregate, then break them down by field position and down.
One way to measure the value of a sack is by first down probability. On third down a sack almost always forces a kick, either a field goal attempt or a punt. But 2nd down and 1st down sacks change the chances for a 1st down conversion in less direct way. A sack in the NFL results in an average loss of 5.2 yards. We can use the chart of first down probabilities below to estimate the effect of a sack.
For example, knowing that a 1st down and 10 results in another 1st down 67% of the time, a sack that forces a 2nd and 15 changes the chance to 38%. A sack on 2nd and 5, that forces a 3rd and 10, changes the chance of a 1st down from 75% to 35%. Generally, a sack drops an offense's chances of converting a 1st down by roughly 30 percentage points. We can apply the very same principle to any plays for a loss. The effect of a 3-yard loss on a run is very similar to that of a 3-yard sack, but not identical as I'll discuss below.
Field position is important. A sack near the 35 yard line can put a team outside of field goal range, forcing a punt. In other cases, it might force a longer more difficult FG kick. Nothing Earth-shattering here, I'm just quantifying the obvious. So let's look at sacks by field position in terms of expected points.
If we average the expected points of all situations in which there wasn't a sack, and compare it with the average expected points following plays that did result in a sack, we get a difference of 2.0 points. In effect, a sack swings the balance of the game by an average of 2 points in favor of the defense, either by forcing a punt or a longer FG try, or even just putting a team in a predictable passing situation. That's a big swing for a single play. A turnover is generally worth 4 points, so a sack could be thought of as half as good as a fumble or interception.
Two points seemed like a lot, so I dug a little deeper. One reason sacks are so valuable is that they often result in fumbles. In fact, even if a quarterback isn't tackled, if he's forced to fumble, even just by a hair, that's technically counted as a sack. So when we take fumbles out of the equation, sacks are worth an average of 1.7 expected points. It's the possibility of a fumble that makes up the extra 0.3 points.
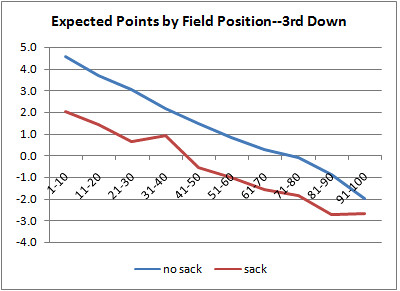
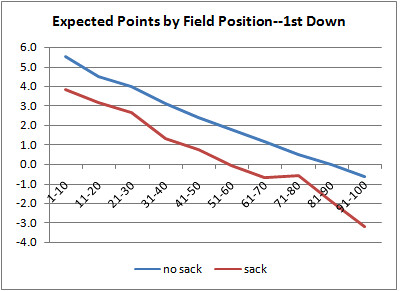
The three graphs below illustrate how field position affects the value of a sack. There is one graph for each offensive down 1st, 2nd, and 3rd. Field position is in terms of distance from the goal line. For example, the "80" is an offense's own 20 yard line. The blue lines are expected points in situations without a sack, and the red lines are situations following a sack.
One thing to note is how the effect changes on the cusp of field goal range. On 3rd down, sacks on plays that started between the 20 and 30 are especially costly to offenses, probably because this makes a field goal far more difficult. On 2nd down, the effect is slightly different. And on 1st down, there doesn't seem to be any special effect near FG range. Offenses still have 2 more downs to recover any yardage given up.
The Value of a Sack


Playoff Probabilities Week 11
 Courtesy of Chris at NFL-Forecast.com, here are the latest playoff probabilities for each team.
These are calculated using the NFL-Forecast software mini-app that runs thousands of simulated seasons. The outcomes are based on game-by-game probabilities with every crazy tie-breaking scenario factored in. Chris uses the probabilities from Advanced NFL Stats as his default game probabilities for the past two seasons.
There are two tables below. The first lists the probability that each team will finish in each place in their division. The second table lists the overall playoff probabilities, broken down by seed.AFC EAST Team 1st 2nd 3rd 4th Miami 61 30 8 1 NY Jets 34 47 17 3 New England 4 16 52 29 Buffalo 1 7 24 68 AFC NORTH Team 1st 2nd 3rd 4th Pittsburgh 94 6 0 0 Baltimore 6 92 1 0 Cleveland 0 2 95 3 Cincinnati 0 0 3 97 AFC SOUTH Team 1st 2nd 3rd 4th Tennessee 100 0 0 0 Indianapolis 0 97 3 0 Jacksonville 0 3 63 34 Houston 0 0 34 66 AFC WEST Team 1st 2nd 3rd 4th Denver 63 37 0 0 San Diego 36 63 0 0 Oakland 0 0 73 27 Kansas City 0 0 27 73 NFC EAST Team 1st 2nd 3rd 4th NY Giants 80 14 4 1 Washington 12 48 27 13 Philadelphia 6 23 34 38 Dallas 2 14 35 48 NFC NORTH Team 1st 2nd 3rd 4th Chicago 52 29 19 0 Green Bay 34 44 23 0 Minnesota 14 27 58 0 Detroit 0 0 0 100 NFC SOUTH Team 1st 2nd 3rd 4th Carolina 51 29 16 4 Tampa Bay 33 36 22 9 Atlanta 13 27 42 19 New Orleans 3 8 20 69 NFC WEST Team 1st 2nd 3rd 4th Arizona 100 0 0 0 San Francisco 0 51 40 10 Seattle 0 38 4 16 St Louis 0 12 14 74 AFC Percent Probability Playoff Seeding Team 1st 2nd 3rd 4th 5th 6th Total Tennessee 93 5 1 0 0 0 100 Pittsburgh 5 57 28 4 1 2 97 Miami 0 21 37 2 12 15 88 Indianapolis 0 0 0 0 55 21 76 NY Jets 1 10 18 5 14 22 70 Denver 0 2 8 53 1 2 66 San Diego 0 0 2 35 1 5 43 Baltimore 0 2 3 1 9 17 33 New England 0 2 2 0 4 11 19 Buffalo 0 0 1 0 2 5 8 Jacksonville 0 0 0 0 0 0 1 Cleveland 0 0 0 0 0 0 0 Houston 0 0 0 0 0 0 0 Oakland 0 0 0 0 0 0 0 Kansas City 0 0 0 0 0 0 0 Cincinnati 0 0 0 0 0 0 0 NFC Percent Probability Playoff Seeding Team 1st 2nd 3rd 4th 5th 6th Total Arizona 14 23 47 16 0 0 100 NY Giants 48 22 9 1 9 5 94 Carolina 22 21 8 1 12 12 76 Washington 5 5 1 0 35 19 66 Tampa Bay 7 17 8 0 12 16 61 Chicago 0 1 11 40 0 1 53 Philadelphia 2 3 1 0 14 16 36 Green Bay 0 0 4 30 0 0 34 Atlanta 1 7 5 0 8 13 34 Dallas 1 1 1 0 9 14 25 Minnesota 0 0 3 11 0 1 15 New Orleans 0 1 2 0 1 3 6 Detroit 0 0 0 0 0 0 0 St Louis 0 0 0 0 0 0 0 San Francisco 0 0 0 0 0 0 0 Seattle 0 0 0 0 0 0 0
Week 12 Game Probabilities
 Win probabilities for week 12 NFL games are listed below. The probabilities are based on an efficiency win model explained here and here with some modifications. The model considers offensive and defensive efficiency stats including running, passing, sacks, turnover rates, and penalty rates. Team stats are adjusted for previous opponent strength.
Pwin GAME Pwin 0.09 
0.91 0.40 
0.60 0.64 
0.36 0.87 
0.13 0.25 
0.75 0.21 
0.79 0.54 
0.46 0.70 
0.30 0.51 
0.49 0.87 
0.13 0.17 
0.83 0.17 
0.83 0.44 
0.56 0.83 
0.17 0.29 
0.71 0.37 
0.63
Week 11 Efficiency Rankings
 The Dolphins are ranked #3 this week. Really? Why is Philly ranked so high but they keep losing, or at least not winning? Chicago's embarrassment at the hands of Green Bay drop them out of the top 10. Buffalo's free-fall continues. Pittsburgh's defense is still carrying a woeful offense toward a possible first-round bye. The Giants inch up after rolling over Baltimore, as does Tennessee after their comeback over the Jaguars.
As I discussed in my recent analysis of both the Dolphins and the Jets, Miami is a very solid team across the board. Despite apparently squeaking by the horrid Raiders 17-15 last Sunday, they actually played quite well. The Dolphins converted 20 first downs compared to only 11 for Oakland. They ran for 6.3 yards per rush and threw for a more modest but above average 6.4 yards per pass attempt. They also held the Raiders to only 3.9 yards per rush and 4.1 yards per pass attempt. Results like these go to show just how deceiving a final score can be (or just how meaningless stats can be, depending on your point of view).
The Eagles are frustrating. By all measures they should be carving up the league. Despite their ability to move the ball and stop opposing offenses, they aren't converting all those yards into wins. Their special teams aren't terribly good--average to slightly below average in most categories (although punt stats are very deceiving because good offenses tend to have less room to punt). Game day coaching tactics might share some blame too. They're also slightly unlucky, with an average defensive interception rate and fumble recovery rate.
But by far, the biggest reason for the Eagles disconnect between efficiency and wins is "bunching." Philadelphia's wins have mostly been blow-outs, and their losses have been squeakers. Their average winning margin has been 18 points while their average losing margin has been less than 5. I can't say conclusively that this bodes well for the Eagles, but I'd definitely rather be a 5-4-1 team with great internal stats than one with very poor ones.RANK TEAM LAST WK GWP Opp GWP O RANK D RANK 1 1 0.76 0.50 8 6 2 2 0.75 0.52 7 7 3 
8 0.70 0.48 4 20 4 
3 0.70 0.52 3 21 5 
4 0.70 0.51 1 22 6 7 0.70 0.46 5 11 7 5 0.69 0.51 18 3 8 
9 0.69 0.53 24 1 9 
10 0.69 0.44 15 2 10 
11 0.67 0.52 2 19 11 6 0.64 0.54 12 9 12 13 0.62 0.54 17 5 13 
12 0.62 0.53 6 23 14 
15 0.60 0.55 19 4 15 16 0.59 0.52 11 8 16 14 0.58 0.53 9 18 17 
21 0.54 0.50 10 25 18 19 0.51 0.44 25 13 19 17 0.50 0.56 22 12 20 22 0.48 0.47 20 24 21 
18 0.48 0.50 21 10 22 20 0.46 0.45 28 14 23 24 0.44 0.50 13 29 24 
23 0.37 0.48 14 27 25 
26 0.34 0.53 16 28 26 
27 0.32 0.48 30 17 27 25 0.29 0.53 26 26 28 28 0.27 0.56 32 15 29 
29 0.25 0.56 23 30 30 30 0.24 0.56 31 16 31 
31 0.16 0.55 27 32 32 
32 0.15 0.56 29 31
To-date efficiency stats below. As always, click on the headers to sort.TEAM OPASS ORUN OINTRATE OFUMRATE DPASS DRUN DINTRATE PENRATE ARI 7.6 3.4 0.018 0.022 6.3 3.8 0.032 0.44 ATL 7.0 4.4 0.021 0.008 6.2 4.9 0.026 0.33 BAL 5.8 4.0 0.032 0.023 5.8 3.4 0.049 0.47 BUF 6.5 3.8 0.038 0.029 6.1 3.9 0.016 0.29 CAR 6.4 4.4 0.032 0.017 5.2 4.0 0.027 0.38 CHI 5.9 3.8 0.018 0.016 5.9 3.4 0.032 0.36 CIN 4.2 3.5 0.029 0.031 6.1 4.2 0.024 0.34 CLE 5.5 4.1 0.022 0.021 7.1 4.7 0.044 0.33 DAL 6.7 4.4 0.040 0.034 5.3 4.2 0.012 0.49 DEN 7.3 4.5 0.029 0.023 6.8 4.9 0.012 0.36 DET 5.4 3.8 0.036 0.032 7.8 5.1 0.007 0.37 GB 6.5 4.0 0.019 0.026 5.1 4.9 0.048 0.56 HOU 6.9 4.5 0.043 0.028 7.1 4.5 0.022 0.25 IND 6.4 3.5 0.024 0.006 6.1 4.3 0.034 0.38 JAX 5.7 4.1 0.019 0.014 6.8 4.3 0.031 0.42 KC 4.9 4.5 0.026 0.024 7.5 5.1 0.032 0.29 MIA 7.1 4.2 0.016 0.016 6.5 3.7 0.022 0.31 MIN 5.7 4.5 0.039 0.025 6.3 3.1 0.018 0.41 NE 5.9 4.2 0.021 0.016 6.8 4.0 0.035 0.25 NO 7.9 3.7 0.028 0.027 6.5 4.3 0.020 0.43 NYG 6.3 5.3 0.023 0.021 5.2 4.0 0.046 0.48 NYJ 6.2 4.4 0.040 0.023 6.1 3.4 0.025 0.28 OAK 4.5 4.3 0.022 0.038 6.2 4.8 0.038 0.44 PHI 6.6 4.0 0.023 0.016 5.3 3.6 0.027 0.32 PIT 5.9 3.6 0.036 0.024 4.4 3.0 0.029 0.44 SD 7.8 3.8 0.034 0.016 6.4 4.1 0.015 0.33 SF 6.1 4.4 0.043 0.041 6.4 3.7 0.028 0.47 SEA 4.6 4.2 0.034 0.014 7.0 4.0 0.014 0.26 STL 5.1 4.1 0.032 0.029 7.8 4.7 0.022 0.41 TB 6.1 4.1 0.024 0.019 5.6 3.8 0.039 0.47 TEN 6.1 4.0 0.020 0.016 4.9 3.8 0.042 0.36 WAS 5.9 4.6 0.010 0.013 5.6 3.7 0.024 0.35 Avg 6.1 4.1 0.028 0.022 6.2 4.1 0.028 0.38