
This is a continuation of an article discussing the amount of luck in determining outcomes in the NFL. In the last post, I compared the actual distribution of team win-loss records over the past five seasons with an idealized pure luck distribution. I found that only 78 out of 160 actual season records (48%) differed from what we’d expect if the NFL were determined completely by luck. In this post, I will compare the actual distribution with an idealized distribution of records in a theoretical league governed by “pure skill.”
A PURE SKILL LEAGUE
A pure skill league would be one in which the better team always won. There would be no upsets. I originally had great difficulty imagining what the distribution of such a league would look like. The very best team would always win 16 games, and the very worst team would always win zero. I suspected that the distribution would be flat in between the two extreme cases so there would be the same number of 3-13 teams as there were 4-12 teams as there were 5-11 teams, etc. I thought the resulting distribution would resemble a trapezoid. I was close.
I created a simulation to determine exactly what a pure-skill distribution would look like. In the simulation there are 32 teams that play sixteen games. The schedule for each team is assigned just as it is in the NFL. Each team plays three teams twice, then plays 10 other games against extra-divisional opponents. Each simulated year creates a unique schedule.
Each year, team #1 is the very best team and #32 is the very worst team. It does not matter which team is #1 or #2 because we merely need to see the distribution of records, not identify which specific teams earned those specific records. Each year there is a very best and a very worst team, and every other team is slotted in between. In the pure-skill league, whenever a team plays an inferior opponent it wins, and whenever it plays a superior opponent it loses. Luck is therefore never a factor.
[Before anyone starts trying to poke holes in the simulation, keep in mind this is a theoretical ideal only, and does reflect all the complications of injuries or weather advantages, etc., nor does it need to. Also, when you see the next post, you will see with your own eyes how realistic the simulation really is.]
The table below gives an abbreviated sample of how I visualized a league schedule in which wins are determined by team strength alone. The team rank column signifies the relative strength of the team. The next column indicates the probability that any given opponent is better than the listed team. The next columns list the opponents for the team in the simulated season. To calculate the wins for each team, I simply counted how many simulated opponents were worse than the listed team.
| Team Rank | Prob. Opp. is Better | Div Gm1 | Div Gm2 | Div Gm3 | … | Gm16 | Wins |
| 1 | 0.00 | 27 | 27 | 32 | … | 25 | 16 |
| 2 | 0.03 | 2 | 2 | 7 | … | 2 | 16 |
| 3 | 0.06 | 18 | 18 | 25 | … | 14 | 15 |
| … | … | … | … | … | … | … | |
| 31 | 0.97 | 30 | 30 | 17 | … | 23 | 1 |
| 32 | 1.00 | 12 | 12 | 2 | … | 20 | 0 |
Thousands of simulated seasons were played out and the resulting distribution is illustrated below.

The distribution shows that about 8% of records result in undefeated season, and the same share results in a winless record. Between 1 and 15 wins, there is an even share of results, each at about 6%.
The distribution appears to be an inverted trapezoid. The extra cases of 0-win and 16-win teams are a result of the schedule format. Because there are 32 teams, and 16 games against 13 opponents, some teams will not play each other each year. So the 31st best team may not get to play the 32nd best team and would end up winless. The #2 team may not have to face the #1 team and would have 16 wins. The same would go for the #3 team, but it would be slightly less likely.
COMPARING PURE SKILL AND OBSERVED
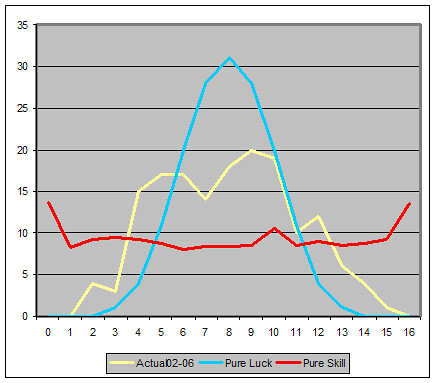
Now let’s look at how the pure skill distribution compares to the actual observed distribution of NFL regular season records over the past 5 years. The two distributions are plotted below on the same scale.

The two distributions are obviously different. The goodness-of-fit chi-square is conclusive as well (p=1.0E-10). But there are some similarities. For example, the actual distribution has somewhat of a plateau through the middle of the range, between 4 and 10 wins. We also see that it is not unusual to see irregularities in the distribution, even for the idealized simulation conducted over many seasons.
In the third and final part of this article, I’ll discuss what all these distributions have in common, and how I mathematically calculated the relationship between them. The result reveals what proportion of NFL game outcomes are decided by luck, and what proportion is decided by the relative strength of each team.


