
 Bill Parcells famously said "You are what your record says you are." Although that's undeniably true with regard to how the NFL selects playoff teams, and I wholeheartedly believe a leader needs to think that way, Parcells is only 58% correct. That's not a joke. It's 58%, and here's how something like that can be measured.
One staple of statistical analysis in sports is estimating how much of a given process is the result of skill and how much is the result of randomness or 'luck'. By luck, I’m not referring to leprechauns, fate, or anything superstitious. Real randomness is far more boring. Imagine flipping a perfectly fair coin 10 times. It would actually be uncommon for the coin to come out 5 heads and 5 tails. (In fact, it would only happen 24% of the time). But if you flipped the coin an infinite number of times, the rate of heads would be certain to approach 50%. The difference between what we actually observe over the short-run and what we would observe over an infinite number of trials is known as sample error. No matter how many times you actually flip the coin, it’s only a sample of the infinitely possible times the coin could be flipped.
As a prime example, the NFL's short 16-game regular season schedule produces a great deal of sample error. To figure out how much randomness is involved in any one season, we can calculate the variance in team winning percentage that we would expect from a random binomial process, like coin flips. Then we can calculate the variance from the team records we actually observe. The difference is the variance due to true team ability.
The Randomness of Win-Loss Records

San Diego's Defensive Woes
 Last July I wrote that the Chargers defense would appear to significantly decline in 2008, even with no change in skill or performance. The reason was that they could not possibly repeat their phenomenally high defensive interception rate. At the halfway mark this season, the Chargers evidently don't think they're doing very well because they just fired their defensive coordinator. But is the Chargers defense really that bad, or is it just unlucky?
Last season San Diego led the NFL with an insanely high 5.4% interception rate. That means they intercepted more than 1 out of every 20 passes attempted. But because defensive interceptions are almost completely random, I forecast that the overwhelming likelihood would be that their 2008 interception rate would be far closer to average. In fact, it's currently well below average at 2.2%. The average so far this year is 2.6%.
Using regression coefficients to weight the importance of each major efficiency stat, we can estimate that the difference in defensive interception rate from 2007 to '08 would cost San Diego 2.6 games over the course of a full season, or about 1.3 games so far this season.
Aside from their interceptions, the Chargers' pass defense is still above average but not as good as last year. So far in 2008, San Diego has allowed 6.2 net yards per attempt compared to an NFL average of 6.3. Last year, they allowed 5.7 net yards per attempt. On average, this would have cost them a difference of 0.8 wins over the course of a full season, or 0.4 wins so far.
Their defensive running efficiency is exactly the same at 4.2 yards per attempt. That's slightly worse than average, which is 4.1 yds per att.
In total, the Chargers interception rate (which is overwhelmingly random) accounts for an estimated 1.3 wins out of a total difference of 1.7, or about 75%.
So Ted Cotrell was fired as defensive coordinator for a drop-off of half a yard per pass attempt, or just less than half a win. The unfortunate loss of pass rusher Shawne Merriman to injury would easily account for such a difference. Now I'll make a new prediction. Because San Diego's interception rate has been so low this year, it's bound to improve (i.e. regress to the mean), and most people will think Cotrell's replacement, Ron Rivera, is to thank.
My point isn't that the Chargers have lost precisely 1.7 games fewer this year because of their defense. My main points are: 1) if you didn't buy how random defensive interceptions really are, maybe you'll reconsider; 2) Cotrell probably shouldn't have been fired; and 3) expect the Chargers defense to improve for the remainder of the year, if only because their interception rate is likely to improve.
Why the Chargers Defense Will Decline in '08
 The San Diego Chargers led the NFL last year with +24 net turnovers. After starting the season slowly with a 1-3 record, they went on to finish 11-5, including ending the regular season on a 6-game win streak. The streak was in large part due to their phenomenally high defensive interception rate. Led at CB by second year sensation Antonio Cromartie who topped the league with 10 picks, San Diego posted an amazing 5.4% interception rate. Unfortunately for Charger fans, interception rates like the this just don't repeat themselves. I'll illustrate exactly why we shouldn't expect the Chargers to duplicate their dominant performance in 2008.
Previously, I've found that team defensive interception stats are extremely inconsistent. The more consistent a stat is, the more likely it is due to a repeatable skill or ability. The less consistent it is, the more likely the stat is due to unique circumstances or merely random luck. In other words, interceptions are thrown far more than they are taken. They have everything to do with who is throwing and with the non-repeating circumstances of the moment.
Defensive interception rates don't even correlate within a season. Offensive interception rates correlate from the first half of a season to the second half with a 0.27 correlation coefficient. In contrast, defensive rates correlate at a much lower (and nearly insignificant) 0.08 coefficient.
Personally, as a Ravens fan I found this hard to accept. Part of the reason I had high hopes for a repeat of their 13-win effort in 2006 was their ability to generate interceptions. I even debated with a reader that interception rates were indeed due to a persistent skill. But now I've come around thanks to a sobering 2007. But Ravens fans are not alone. The 2002 Buccaneers, the 2005 Bengals, and the 2003 Vikings--the teams with the highest interception rates since the 2002 expansion--all suffered dramatic declines the following year.
The chart below plots current year interception rates against the previous year's rates for each team from 2002-2007. If there were any persistence of high or low rates we'd see a trend from from the lower left to the upper right. In fact, we don't see any trend at all, just a big blob. This indicates that interception rates are non-persistent and highly random from year to year.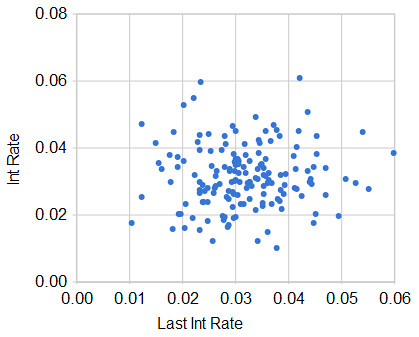
vs. Previous Yr Interception Rate
 Why are interception rates so random? First, they are by nature fairly chaotic and complex events. Tipped and bobbled passes contribute to a team's total. Second, because interception stats are relatively persistent for an offense, defensive stats are driven by who the opponents happen to be. Most opponents rotate from year to year, and poor division opponents tend to improve while good ones tend to decline. Lastly, extremely good performances are usually due to a confluence of favorable factors such as injuries, player match-ups, or even weather conditions. There is no reason to expect such good fortune in consecutive years.
I'm not predicting the Chargers rate will be below average or even average. However, I am saying it is extremely likely that the Chargers will have far fewer interceptions in 2008 than they did last year. Based on recent history, by far the best bet is that they'll be pretty close to average. There's almost no possibility they'll have another year with anything close to the 5.4% rate from 2007.
Based on the historical regression trend, the Chargers would be expected to decline by 2.1 percentage points to a very average 3.3%. If the Chargers face a similar number of pass attempts as they did in 2007, they'd go from 30 interceptions to about 18.
Further, we can estimate what kind of effect this decline could have on the Chargers' record using the regression model very similar to the one discussed here. In short, all other factors being equal, a team can expect to win about 0.6 fewer games for every 1.0% decline in interception rate. In the Chargers' case, this translates to a difference of 1.3 fewer wins. The Bolts could defy gravity, but don't hold your breath.
Turnovers and 2008 Expected Wins
 In a post from last year I noted how team records tend to regress to the mean from year to year based on how well a team did regarding interceptions. When teams did notably well in either offensive (low) or defensive (high) interceptions, the overwhelming trend was for them to win fewer games the following year. Likewise, teams with poor interception stats tended to win more games the following year.
When we look at team records from year to year, regression to the mean dominates. Good teams win fewer games the next year, and bad teams win more. This tendency is extremely strong as illustrated by the graph below. The horizontal x-axis represents each team's regular season win total from the prior year. The vertical y-axis is the change in each team's win total from the prior year to the subsequent year. The more wins a team had, the farther the drop in the following year. Likewise, the fewer wins a team had, the stronger the improvement. For example, the typical 13-win team will tend to win 4 fewer games the following year. And the typical 4-win team will tend to win 3 more. I previously attributed the strength of the regression phenomenon to the scheduling system which matches opponents according to how they placed in their respective divisions, the draft which allocates draft position in reverse order of win-loss records, and salary cap boom/bust cycles in which individual teams load up on talented and costly players, then 'purge' their rosters to recover salary cap room for the dead weight of past signing bonuses.
While those considerations are very likely to contribute to the churn of team records, I now believe the major cause is the randomness of turnovers. Each team's turnover stats have a random component--think of tipped passes or fumbles bouncing on the turf. To test how strongly turnovers drive the phenomenon of win regression, I calculated the correlations between each turnover stat and the year-to-year change in team win totals (Win Δ). The data is from all 32 teams' five season-pairs from the 2002-2007 regular seasons (n=160).
| Stat | Win Δ Correlation |
| Int Taken | -0.34 |
| Fum Taken | -0.10 |
| Net Takeaway | -0.32 |
| Int Thrown | 0.36 |
| Fum Lost | 0.25 |
| Net Giveaway | 0.38 |
| Net TO | -0.47 |
These are very strong correlations, considering we are estimating next year's wins with previous year's stats. It's important to point out these are inverse correlations. The better a team does in terms of turnovers one year, the fewer games it is expected to win the following year. To put this in context with other correlations in the NFL, current year TD passes correlate at 0.50 with current year wins.
Based on each team's 2007 turnover stats we can estimate their improvement or decline for 2008. The estimates are based on a linear regression on Win Δ by fumbles lost, fumbles taken, interceptions thrown, and interceptions taken. Those teams that benefited the most from favorable turnover stats would be expected to decline, and vice versa. The table below lists each team and their expected change in wins from 2007 to 2008.
(One caveat--these are not definitive predictions for 2008, these are just based on the overwhelming tendency for teams to regress based on turnovers. Think of these as estimates about which other factors, such as injuries and fundamental improvement or decline, would operate.)
| Team | Int Taken | Fum Taken | Int Thrown | Fum Lost | Net TO | Exp Win Δ |
 HOU HOU | 11 | 14 | 21 | 17 | -13 | +3.0 |
 BAL BAL | 17 | 6 | 14 | 26 | -17 | +2.3 |
 SF SF | 12 | 10 | 17 | 17 | -12 | +2.2 |
 STL STL | 18 | 9 | 28 | 9 | -10 | +1.9 |
 KC KC | 14 | 8 | 20 | 13 | -11 | +1.8 |
 OAK OAK | 18 | 8 | 20 | 17 | -11 | +1.6 |
 NYG NYG | 15 | 10 | 20 | 14 | -9 | +1.6 |
 ARI ARI | 18 | 11 | 24 | 12 | -7 | +1.4 |
 NO NO | 13 | 10 | 18 | 12 | -7 | +1.3 |
 PHI PHI | 11 | 8 | 15 | 12 | -8 | +1.2 |
 DET DET | 17 | 18 | 22 | 14 | -1 | +1.0 |
 MIA MIA | 14 | 8 | 16 | 13 | -7 | +0.9 |
 CHI CHI | 16 | 17 | 21 | 13 | -1 | +0.9 |
 WAS WAS | 14 | 10 | 11 | 18 | -5 | +0.6 |
 CAR CAR | 14 | 16 | 17 | 12 | 1 | +0.4 |
 CLE CLE | 17 | 10 | 20 | 9 | -2 | +0.3 |
 NYJ NYJ | 15 | 6 | 19 | 6 | -4 | +0.3 |
 DEN DEN | 14 | 16 | 15 | 14 | 1 | +0.3 |
 MIN MIN | 15 | 16 | 14 | 16 | 1 | +0.2 |
 PIT PIT | 11 | 14 | 14 | 8 | 3 | -0.2 |
 TEN TEN | 22 | 12 | 17 | 17 | 0 | -0.2 |
 CIN CIN | 19 | 16 | 20 | 10 | 5 | -0.4 |
 ATL ATL | 16 | 12 | 15 | 9 | 4 | -0.7 |
 DAL DAL | 19 | 10 | 19 | 5 | 5 | -1.1 |
 GB GB | 19 | 9 | 15 | 9 | 4 | -1.2 |
 BUF BUF | 18 | 12 | 14 | 7 | 9 | -1.7 |
 SEA SEA | 20 | 14 | 13 | 11 | 10 | -1.9 |
 TB TB | 16 | 19 | 8 | 12 | 15 | -2.3 |
 JAX JAX | 20 | 10 | 8 | 13 | 9 | -2.3 |
 IND IND | 22 | 15 | 14 | 5 | 18 | -3.2 |
 NE NE | 19 | 12 | 9 | 6 | 16 | -3.2 |
 SD SD | 30 | 18 | 16 | 8 | 24 | -4.2 |
Why does randomness and regression to the mean appear so strong in the NFL? I think it's due to a combination of a short schedule and team parity. Sixteen games is simply not long enough for "the breaks" to even out. And if the opponents are relatively equal in ability, then random factors will play a large role in determining game outcomes. When randomness is decisively involved, regression to the mean will be a strong force from year to year.
Luck: Epilogue
Coincidentally, as I was posting the results of my look at the amount of luck in NFL games, Phil Birnbaum posted this at his site. He was sharing a paper he did a while back about how "truly" good an MLB team is that wins 100 games. If some games are won on merit, and some by luck, then his calculations say the average 100 game winner won by luck 7 games more than they merited based on the their talent level. In other words, 100 game winners are probably both good and lucky.
But even more interesting was another tidbit Phil linked to. If you follow the references, you land here on Tom Tango's site. He's another accomplished sabermetrician. He approached the question of luck in sports outcomes far more elegantly than I did.
There, he works through his math calculating how many games are required for a sports league to produce the "true" best team on top of the standings. For MLB he says it's 69 games, and for the NFL it's 12 games.
Along the way, Tango articulates his theory. Regarding the distribution of win-loss records, the observed variance is: variance(observed) = varance(true) + variance (luck). Since we know the variance of the observed distribution (SD^2), and we know the variance of luck from the binomial distribution (p=0.5, n=16), we can solve for variance (true), which is the variance in team records based on merit.
I'm not sure what to think about his method. His theory assumes the "true" distribution (what I call pure-skill) is narrower than the observed distribution. Then luck acts on the true distribution to widen it.
But my simulations show that the distribution of a pure merit league is much wider than either the observed or the luck distributions. So I'm not sure how to interpret his theory.
On another note, I reran my simulation against the 96-01 NFL seasons. The scheduling system was a little different then, but the effect should be minimal. The simulation maximized its goodness-of-fit at 51% luck, which is pretty much what I found for the 02-06 seasons.

Upcoming posts include a look at YAC stats and how they affect QB stats, and a look at what really produces rushing TDs--something for the fantasy football fans out there.
Luck and NFL Outcomes 3
This is the third and final post of an article discussing the amount of luck in determining outcomes in the NFL. In the first post, I compared the actual distribution of team win-loss records over the past five seasons with an idealized pure luck distribution. I found that only 78 out of 160 actual season records (48%) differed from what we’d expect if the NFL were determined completely by luck.
In the second post, I compared the actual distribution with an idealized distribution of records in a theoretical league governed by “pure skill.”
In this post, I will unify the three distributions--actual, luck, and skill--into one algorithm. The resulting equation reveals the proportion of NFL games in which the deciding factor is luck and not the camparitive strength of each opponent.
LUCK, SKILL, AND OBSERVED
The chart below is a histogram of the pure binomial distribution, the simulated pure-skill (zero luck) distribution, and the actual distribution of NFL records since the '02 expansion. (Pure luck is blue, actual is yellow, and pure skill is red.)

When I first examined the three distributions together, I was struck by how the actual distribution appeared to split the difference between the luck and skill distribution. The actual records appear to be some sort of combination of the luck and skill distributions. To me, it looked as if the pure-luck binomial distribution was pressed into a flatter and wider distribution by skill.
LUCK/SKILL SYNTHESIS
It dawned on me to create another simulation, one that synthesized the pure-luck and pure-skill distributions together in varying degrees. (10% luck/90% skill, 20% luck/80% skill, etc.) Basically, the luck% variable determined a percentage of games (chosen at random) to be decided by pure luck, essentially a coin flip. The remainder of the games were credited to the superior team. The simulation algorithm looked like this:
If rand() < %luck, then game outcome = pure luck, else game outcome = win by the better team
I varied the %luck value between 0 and 1, re-running the simulation. Here are some representative win distributions (legend is in %luck):

Next I overlayed the actual distribution.

PROPORTION OF LUCK IN NFL OUTCOMES
Then I varied the %luck value until it maximized the goodness of fit between the actual distribution and the synthesized distribution. At 52.5% luck, the theoretical distribution is statistically indistinguishable from the actual distribution (chi-square goodness of fit p=0.94). This means it is 94% probable that the discrepancies between the synthesized simulation and the actual observations are merely due to sample error.

THEORETICAL MAXIMUM PREDICTION RATE
I will be very careful in stating what conclusion I draw from this exercise. The actual observed distribution of win-loss records in the NFL is indistinguishable from a league in which 52.5% of the games are decided at random and not by the comparative strength of each opponent.
I admit 52.5% seems very high. But keep in mind, that half of the time, the better team wins by luck. In other words, half the time our prediction models are correct by chance, just like a monkey picking winners would be. If the 52.5% figure is correct, the best any prediction model could do is:
0.50 + 0.525/2 = 0.76
So 76% correct would be the theoretical ceiling for NFL game prediction models. This is consistent with the various computer models as well as odds makers. It is also consistent with our intuitive experience--upsets seem happen about a quarter of the time. Sometimes a model (or a person) can predict at better than a 76% correct rate, but anything above that would be...by luck.
I also posted a follow up to this series of articles here.
A Definition of Luck in Sports
This post is a little different than my others. I think it would serve my luck research well if I take some time to explain what I define as luck.
Luck is just my shorthand for a random process, and I admit using the word luck may be misleading. A random process is merely one in which the outcome cannot be controlled, and that each possible outcome has an equal chance of occurring. The accumulation of effects of several random processes results in a normal distribution, like balls bouncing down a Pachinko board.
Flipping a coin is not luck in a strict technical sense. It is dependent on its original position, the rate of spin imparted, the height of the toss, etc. But the outcome cannot be controlled, and each possible outcome is equally likely. Hence, it is indistinguishable from a true random process--what could just as well be called luck. In football, as in any sport, there are many processes similar to a coin flip.
One example would be a punt that first lands on the 5 yard line. Does it die on the 2 yard line or will it bounce into the endzone for a touchback? Once the punt hits the ground it is no longer under the influence of the punter in any way. Over time the randomness will average out and good punters will tend to prevent more touchbacks. But where this one punt lands today, in this one game, right now, is partly random.
Randomness can play a very strong role in the outcome of any single game. Consider a baseball game between a team and its perfect equal in every measure. In this evenly matched game, each team hits 9 singles. Team A happens to get its singles within 3 innings, then goes hitless for 6. Each inning of 3 singles produces 1 run. Team B's 9 singles happen to be spread across 9 innings, resulting in zero runs. Team A wins 3-0, although each team performed equally well.
The total number of singles produced by a team is controlled by the interaction of skills between batters, pitchers, and defense--certainly not luck. But, when the singles occur and how they are bunched cannot be controlled, and their distribution is equally likely throughout the game. Batters have zero ability to chose when their hits occur. If they did, everyone's average with "runners in scoring position" would be much higher. Therefore, when the hits occur is indeed random, and consequently, a sizable part of the outcome of a any single game is random.
It's why the Devil Rays sometimes beat the Yankees. They weren't the better team that day. They just benefited more from a random dispersion of events more than their opponents did.
Baseball managers have understood this effect for generations. This is partly why a team's lineup is usually constructed with its best batters bunched together in order. It maximizes the probability that hits will come in bunches. This technique skews the random distribution positively, but does not reduce the randomness of the process itself.
Football is very different from baseball, but the bunching effect exists on the grid-iron too. Scoring drives are not just dependent on achieving several first downs, but on achieving consecutive first downs. The total number of first downs earned is determined by the relative strength of each team, but how dispersed they are is random. So part of the game outcome is due to the teams' comparative strength, and part is due to a random process.
Randomness is an essential part of the physical universe. Perhaps instead of luck I should use the word chance or randomness. Luck implies superstition, to which I certainly do not subscribe. I do not believe one side or the other enters a contest with some Goddess of Luck smiling its side. Instead of saying "the Giants had luck on their side today," I should say "the cumulative outcome of uncontrolled random processes favored the Giants in this game."
But if you don't buy into randomness--what I call luck--you're in good company. Einstein denied it too. His feelings were summed in his quote "God does not play dice with the universe." Randomness offended his sense of a rational universe, just as many sports fans are offended by the role luck plays in sports. Unfortunately, his refusal to accept it brought his research to a dead end. Subsequent research led to quantum physics, which confirms randomness as a fundamental property of reality.
Lastly, if you don't believe in randomness you must not be reading this. One of the greatest human technological advances in history requires randomness to exist and be quantifiable--the microprocessor.
Luck and NFL Outcomes 2
This is a continuation of an article discussing the amount of luck in determining outcomes in the NFL. In the last post, I compared the actual distribution of team win-loss records over the past five seasons with an idealized pure luck distribution. I found that only 78 out of 160 actual season records (48%) differed from what we’d expect if the NFL were determined completely by luck. In this post, I will compare the actual distribution with an idealized distribution of records in a theoretical league governed by “pure skill.”
A PURE SKILL LEAGUE
A pure skill league would be one in which the better team always won. There would be no upsets. I originally had great difficulty imagining what the distribution of such a league would look like. The very best team would always win 16 games, and the very worst team would always win zero. I suspected that the distribution would be flat in between the two extreme cases so there would be the same number of 3-13 teams as there were 4-12 teams as there were 5-11 teams, etc. I thought the resulting distribution would resemble a trapezoid. I was close.
I created a simulation to determine exactly what a pure-skill distribution would look like. In the simulation there are 32 teams that play sixteen games. The schedule for each team is assigned just as it is in the NFL. Each team plays three teams twice, then plays 10 other games against extra-divisional opponents. Each simulated year creates a unique schedule.
Each year, team #1 is the very best team and #32 is the very worst team. It does not matter which team is #1 or #2 because we merely need to see the distribution of records, not identify which specific teams earned those specific records. Each year there is a very best and a very worst team, and every other team is slotted in between. In the pure-skill league, whenever a team plays an inferior opponent it wins, and whenever it plays a superior opponent it loses. Luck is therefore never a factor.
[Before anyone starts trying to poke holes in the simulation, keep in mind this is a theoretical ideal only, and does reflect all the complications of injuries or weather advantages, etc., nor does it need to. Also, when you see the next post, you will see with your own eyes how realistic the simulation really is.]
The table below gives an abbreviated sample of how I visualized a league schedule in which wins are determined by team strength alone. The team rank column signifies the relative strength of the team. The next column indicates the probability that any given opponent is better than the listed team. The next columns list the opponents for the team in the simulated season. To calculate the wins for each team, I simply counted how many simulated opponents were worse than the listed team.
| Team Rank | Prob. Opp. is Better | Div Gm1 | Div Gm2 | Div Gm3 | … | Gm16 | Wins |
| 1 | 0.00 | 27 | 27 | 32 | … | 25 | 16 |
| 2 | 0.03 | 2 | 2 | 7 | … | 2 | 16 |
| 3 | 0.06 | 18 | 18 | 25 | … | 14 | 15 |
| … | … | … | … | … | … | … | |
| 31 | 0.97 | 30 | 30 | 17 | … | 23 | 1 |
| 32 | 1.00 | 12 | 12 | 2 | … | 20 | 0 |
Thousands of simulated seasons were played out and the resulting distribution is illustrated below.

The distribution shows that about 8% of records result in undefeated season, and the same share results in a winless record. Between 1 and 15 wins, there is an even share of results, each at about 6%.
The distribution appears to be an inverted trapezoid. The extra cases of 0-win and 16-win teams are a result of the schedule format. Because there are 32 teams, and 16 games against 13 opponents, some teams will not play each other each year. So the 31st best team may not get to play the 32nd best team and would end up winless. The #2 team may not have to face the #1 team and would have 16 wins. The same would go for the #3 team, but it would be slightly less likely.
COMPARING PURE SKILL AND OBSERVED
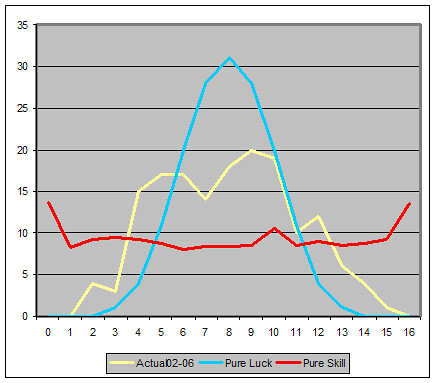
Now let’s look at how the pure skill distribution compares to the actual observed distribution of NFL regular season records over the past 5 years. The two distributions are plotted below on the same scale.

The two distributions are obviously different. The goodness-of-fit chi-square is conclusive as well (p=1.0E-10). But there are some similarities. For example, the actual distribution has somewhat of a plateau through the middle of the range, between 4 and 10 wins. We also see that it is not unusual to see irregularities in the distribution, even for the idealized simulation conducted over many seasons.
In the third and final part of this article, I’ll discuss what all these distributions have in common, and how I mathematically calculated the relationship between them. The result reveals what proportion of NFL game outcomes are decided by luck, and what proportion is decided by the relative strength of each team.
Luck and NFL Outcomes 1
INTRODUCTION
Over the past few weeks, I've been interested in the amount of luck in NFL outcomes. I was interested primarily because I wanted to know just how good a game prediction model can get. In other words, what's the theoretical best that a prediction model can do? 70% correct? 95% correct? I think I've stumbled upon the answer.
The very best computer models predict winners at only a 70-75% rate. But that's not saying much because a monkey could predict winners 50% of the time. A monkey who knows which team is the home team could be correct 58% of the time. Even the Las Vegas odds makers aren't much better. They're correct less than 65% of the time.
It got me thinking. If a team is the very best team in the NFL, why wouldn't it have a 100% chance of winning each game? Why aren't there lots of 16-win teams? I thought that there must be good deal of luck involved to prevent the #1 team in the league from winning more than 13 or 14 games each year. Otherwise, why wouldn't the best team win 16 games every year?
In this post, I'll compare the actual distribution of NFL season wins to the distribution of a league determined by pure luck. Next, I'll compare the actual distribution to a league that theoretically is based on pure skill. Then finally, I'll show how I mathematically synthesized those two comparisons to determine exactly how much of the NFL is really just luck.
WHAT I MEAN BY LUCK
I'm not talking about a freak gust of wind or a slick patch of turf at a critical time and place to alter the outcome of a game. Although things like that happen, I'm talking about a much more ordinary phenomenon. An example I've used before goes like this:
Consider a very simple example game. Assume both PIT and CLE each get 12 1st downs in a game against each other. PIT's 1st downs come as 6 separate bunches of 2 consecutive 1st downs followed by a punt. CLE's 1st downs come as 2 bunches of 6 consecutive 1st downs resulting in 2 TDs. CLE's remaining drives are all 3-and-outs followed by a solid punt. Each team performed equally well, but the random "bunching" of successful events gave CLE a 14-0 shutout.
The bunching effect doesn't have to be that extreme to make the difference in a game, but it illustrates my point. Natural and normal phenomena can conspire to overcome the difference between skill, talent, ability, strategy, and everything else that makes one team "better" than another.
For more on how I define luck, see this post.
A PURE LUCK LEAGUE
What if the NFL was 100% luck? By that I mean, "what if the winner of each game was determined as if it were a flip of a fair coin?" The binomial distribution gives us the answer. The distribution mimics a bell-curve normal distribution. The graph below is a histogram of season win totals in a pure luck league.
As we'd expect, it illustrates that in such a league with 16 games, 8 wins would be the most common season outcome. About 20% of all teams would finish 8-8. About 5% of all teams would finish 11-5 and another 5% would finish 5-11. Almost no teams would finish undefeated or winless (each having a 0.00002 probability).
This type of league represents perfect parity. Every team has exactly a 50% chance of winning each game. To spectators (and NFL analysts) however, it would still appear that some teams are "better" than others. Some teams would even appear "hot" because they won several games in row, when in reality it's just an artifact of luck. (Sometimes when you flip a coin you get heads a few times in a row.) Does the coin have momentum? Is it hot? Some coins would have an above average number of heads several seasons in a row. Is that coin a dynasty?
But the real question is: How does the actual distribution of NFL regular season wins compare to the hypothetical luck league? How different is the observed distribution from an idealized distribution of pure luck? The histogram below shows the distribution of the actual NFL regular season win totals for every team since 2002, when the current division structure and scheduling system began. It's slightly irregular because it represents just five seasons (160 team records).
9-7 turns out to be the most common W-L record, followed by 10-6. I didn't expect that. At first, I thought I had discovered something interesting in the "dip" that the distribution takes at 7 wins. I thought that it was evidence that, even more often than we'd expect, teams with playoff hopes usually beat teams with nothing to gain at the end of the season. This effect would result in extra occurrences of 10-game winners. But after running many simulations of random sets of five seasons, irregularities like that were very common by chance alone. (More on that later.)
Let's compare the two distributions--pure luck vs. actual. The next histogram shows both distributions together, and at the same relative scale.
So how different are the distributions? Statistically, they are absolutely not similar. The goodness-of-fit test for two distributions is the chi-square test. It tells us it is infinitesimally unlikely that the actual distribution is sampled from the binomial distribution (p=8.9E-34). But that is obvious enough by just looking at them. To me, it looks like the actual distribution is a flattened version of the binomial distribution. It's as if something is "squashing" the luck distribution to create the actual distribution.
By comparing the two distributions, we can calculate that of the 160 season outcomes, only 78 of them differ from what we'd expect from a pure luck distribution. That's only 48%, which would suggest that in 52% of NFL games, luck is the deciding factor!
To me, that was too hard to accept. Frankly, I didn't buy it, so I kept at it. In part 2 of this article I'll re-attack the question from the opposite direction. I'll compare a theoretical "pure skill" league with the actual NFL win distributions. We'll see that it's skill that's "squashing" the luck into the actual distribution.