
I recently wrote about clutch QB performance in the post-season. This post will take a look at clutch QB performance in the regular season and how well it persists from year to year. The approach is to compare how well a QB performs in high-leverage situations to how well he performs without respect to leverage. To do this, we can compare his Expected Points Added (EPA) to his Win Probability Added (WPA). This involves computing an "expected" WPA for each QB's season based on his EPA. The difference between a QB's actual WPA and his expected WPA could be considered his "clutch-WPA."
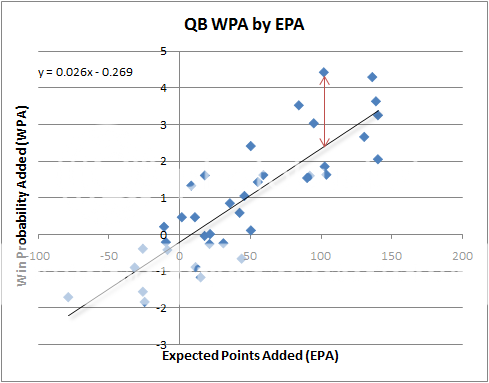
Here is a graphical depiction of what I'm talking about. This chart is from a 2010 article on clutch play. The vertical distance between a QB's expected WPA and his actual WPA, shown as the red line below, is clutch-WPA.
For this analysis, I used per-play metrics: EPA per play, WPA per play, and clutch-WPA per play. Only QB seasons with greater than 200 pass attempts were included.
To estimate "persistence" I measured the year-to-year correlation in our three variables of interest. The idea is that the stronger the correlation, the more persistent the measure is as a quality of that QB. If there is no year-to-year correlation, then the variable may only be random.
The table below lists QB year-pairs and their correlation in our three variables of interest. The 'n' column lists the number of year-pairs in the analysis. For example, the 1 - 2 row represents the 90 cases of first and second seasons each QB appears in the database. The database begins in 2000, so year 1 does not necessarily represent a QB's rookie season or his initial season with 200 attempts. (Note that both seasons in each year pair had > 200 pass attempts.)
| QB Yrs | n | EPA/P | WPA/P | Cl.-WPA/P |
| 1 - 2 | 90 | 0.36 | 0.27 | 0.05 |
| 2 - 3 | 67 | 0.24 | 0.20 | -0.03 |
| 3 - 4 | 51 | 0.53 | 0.51 | 0.26 |
| 4 - 5 | 36 | 0.61 | 0.44 | -0.09 |
| 5 - 6 | 30 | 0.32 | 0.11 | -0.32 |
| 6 - 7 | 19 | 0.50 | 0.24 | -0.21 |
| 7 - 8 | 12 | 0.61 | 0.49 | -0.21 |
| 8 - 9 | 9 | 0.68 | 0.80 | 0.38 |
| 9 - 10 | 6 | 0.85 | 0.91 | 0.54 |
| 10 - 11 | 6 | 0.57 | 0.55 | -0.01 |
As I expected, EPA per play is the most persistent. WPA per play is the next most, but I was surprised at just how well is correlates season to season. As we've witnessed watching the game win probability graphs, there can be some wild swings in WP for just a few critical plays. Clutch-WPA appears to be all over the map. EPA and WPA persist, but we can't conclude that clutch WPA does.
For good measure, I repeated the correlation analysis for alternate seasons. For example, I tested the correlation between each QB's 1st and 3rd seasons, 2nd and 4th seasons, etc. The same general relationships appear.
| QB Yrs | n | EPA/P | WPA/P | Cl-WPA/P |
| 1 - 3 | 67 | 0.35 | 0.32 | 0.07 |
| 2 - 4 | 51 | 0.43 | 0.36 | 0.10 |
| 3 - 5 | 36 | 0.32 | 0.27 | 0.12 |
| 4 - 6 | 30 | 0.33 | 0.23 | 0.00 |
| 5 - 7 | 19 | 0.22 | 0.08 | -0.20 |
| 6- 8 | 12 | 0.63 | 0.65 | 0.13 |
| 7 - 9 | 9 | 0.75 | 0.65 | -0.30 |
| 8 - 10 | 6 | 0.94 | 0.88 | -0.09 |
| 9 - 11 | 6 | 0.75 | 0.75 | -0.24 |


Brian, can you also give one grand total (row with n=326)?
I could, but I was too tired last night to try to reorganize the data to do that. But more importantly, the deeper into a QBs career you get, the fewer QBs exist and the selection effect gets much stronger in the later years than the early years.
Tom,
Here are the correlations for all year pairs (n=326):
EPA/P 0.48
WPA/P 0.36
Cl-WPA/P -0.01