- Home Posts filed under quarterbacks
Nick Foles and Interception Index Regression
With one week of the 2014 season in the books, Foles and McCown have already matched that combined total. While everyone should have expected both to regress from their remarkably turnover-free 2013 seasons, that does not tell us how far each should regress based on historical norms.
Separating Receiver from Quarterback: A Start
Ty Aderhold and David Freed are second-year members of the Harvard Sports Analysis Collective. Ty is a sophomore majoring in History and Science with a minor in Global Health and Health Policy, and is a big fan of all Atlanta sports teams (proving Atlanta sports fans do actually exist). David is majoring in applied math (focusing on economics) and minoring in statistics. He is currently looking for a vintage Vince Carter Raptors jersey.
One of the biggest stories from Sunday was Calvin Johnson’s monstrous 329-yard receiving day, which prompted teammate Reggie Bush to call him “the greatest of all time” after the game. By contrast, because it came in a win, Tom Brady’s 116-yard performance went under the radar. Johnson’s big day and Brady’s less-than-stellar one prompt questions about the relationship between a quarterback and his top receiver.
One of the central figures in this debate is Matthew Stafford. For almost his entire NFL career, many have considered him a quarterback that relies on Johnson for his success. Stafford’s recent struggles in the Lions’ Week 5 game against the Packers in which Johnson didn’t play only added credence to this theory. At the same time, Tom Brady has been regarded for years as a superstar quarterback that can generate above average stats for otherwise pedestrian receivers. Many considered it to be Brady that made Wes Welker great, not the other way around. However, it has been apparent throughout the season, as it was against the Dolphins this past weekend, that Brady is suffering from a lack of talented receivers (and, potentially, an undisclosed injury). This post takes a step towards separating the value of a quarterback from his top receiver so we can better compare quarterback play across the league. It will also take an in-depth look at Matthew Stafford and Tom Brady with the goal of better understanding these quarterbacks and their successes with the likes of Calvin Johnson and Wes Welker.
To begin separating out the value of a quarterback from that of his top receiver, we looked at the best quarterback from each team in 2012 and his top receiver (defined as the receiver who gained the most yards). We also limited our data only to games that the quarterback and receiver played together. After computing the raw quarterback ratings for each quarterback, we subtracted those plays on which he targeted his best receiver and recalculated his statistics.
Point / Counterpoint on Rodgers' Extension
Brian 1: Rodgers' new deal is a fantastic bargain. He's one of the truly elite QBs in the league today, and guys like that don't grow on trees. But more scientifically, just look at this super scatterplot I made of all veteran/free-agent QBs. The chart plots Expected Points Added (EPA) per Game versus adjusted salary cap hit. Both measures are averaged over the veteran periods of each player's contracts. I added an Ordinary Least Squares (OLS) best-fit regression line to illustrate my point (r=0.46, p=0.002).
Rodgers' production, measured by his career average Expected Points Added (EPA) per game is far higher than the trend line says would be worth his $21M/yr cost. The vertical distance between his new contract numbers, $21M/yr and about 11 EPA/G illustrates the surplus performance the Packers will likely get from Rodgers.
(This plot includes for all free-agent or veteran extensions since 2006. Cap figures are averaged for each player's career and, to account for cap inflation, are adjusted for overall league cap ceiling by season. Only seasons with 7 or more starts were included.)
Clutch Persistence?
I recently wrote about clutch QB performance in the post-season. This post will take a look at clutch QB performance in the regular season and how well it persists from year to year. The approach is to compare how well a QB performs in high-leverage situations to how well he performs without respect to leverage. To do this, we can compare his Expected Points Added (EPA) to his Win Probability Added (WPA). This involves computing an "expected" WPA for each QB's season based on his EPA. The difference between a QB's actual WPA and his expected WPA could be considered his "clutch-WPA."
Here is a graphical depiction of what I'm talking about. This chart is from a 2010 article on clutch play. The vertical distance between a QB's expected WPA and his actual WPA, shown as the red line below, is clutch-WPA.
For this analysis, I used per-play metrics: EPA per play, WPA per play, and clutch-WPA per play. Only QB seasons with greater than 200 pass attempts were included.
To estimate "persistence" I measured the year-to-year correlation in our three variables of interest. The idea is that the stronger the correlation, the more persistent the measure is as a quality of that QB. If there is no year-to-year correlation, then the variable may only be random.
The table below lists QB year-pairs and their correlation in our three variables of interest. The 'n' column lists the number of year-pairs in the analysis. For example, the 1 - 2 row represents the 90 cases of first and second seasons each QB appears in the database. The database begins in 2000, so year 1 does not necessarily represent a QB's rookie season or his initial season with 200 attempts. (Note that both seasons in each year pair had > 200 pass attempts.)
One Point Favoring Andrew Luck over Robert Griffin III
Arguments on the Rookie of the Year seem to be favoring Robert Griffin III over Andrew Luck at this point in the season. Griffin's performance has been spectacular, certainly -- he's thrown for 2,660 yards and 17 touchdowns against just four interceptions. His 714 rushing yards on 105 carries translates to a league-leading 6.8 yards per carry, and his 6.5 AYPA is tied with Peyton Manning for third in the league.
Luck runs well, but nowhere near Griffin's standard -- he owns 216 yards on 44 rushes. Luck has thrown for over 900 more yards than Griffin and matched Grffin's 17 touchdowns. But his AYPA is a middling 5.1, 21st in the league and tied with Andy Dalton. Griffin has a 23-point EPA advantage and a 0.09 point per play advantage.
But for those who prefer to use more context-neutral stats -- as opposed to WPA, which has Luck second in the league at 4.32, over 1.5 wins better than Griffin -- there is one point in Luck's favor: the sheer volume of his output.
Washinton's' offense is obviously focused on Griffin, but the team uses the run liberally, rushing over 22 times per game (not counting Griffin's rushes). Alfred Morris carries the bulk of the load, with 1,106 yards (4.8 per carry) on the season. The Colts have rushed just 22 times per game themselves, but they've also run 117 more plays (just under 10 per game) more than Washington, and those extra plays are all directed through Luck and the passing game. All told, Luck has thrown 14 more passes per game than Griffin.
Basketball analysts have picked up on an essential point of the game: as usage rate -- the burden of the offense -- increases, efficiency tends to decrease. Steve Kerr was a more efficient scorer for the 1995 Chicago Bulls -- he shot 52.4 percent from three -- but there was no way he could take 22 shots per game with any efficiency. Jordan continued to excel even when confronted with the most difficult shots -- under duress, at the end of the shot clock, or both.
There's a similar relationship with quarterbacks. The idea that certain quarterbacks can only handle 20-to-25 throws per game with efficiency holds up in the data. Observe, the average yards per attempt given a certain attempt total (data includes all games since 2009):
Year-to-Year Improvement and Decline at QB
Air Yards 2011
It's not that QBs shouldn't be credited at all, because if a pass isn't completed there can be no yards after catch at all. And the argument that a very accurate QB that can hit a receiver in stride or lead him to open space to create YAC can't be ignored. Scheme matters too. But it's evident that some QBs feast on the YAC-gaining abilities of their receivers much more than others, distorting their overall stats.
I came up with Air Yards a few years ago as a method to compare passers with their receiver's YAC removed. Air Yards is simply the complement of YAC. It's the yardage a pass travels through the air forward of the line of scrimmage. AY is a unique and interesting way to view QB performance, but it's not perfect. A QB would be penalized for completing a short screen that's caught a yard to two behind the line of scrimmage. But those plays are few and far between, and I don't lose any sleep worrying about them. We should also keep in mind that a QB's performance is never just his own. But AY might be an inch closer to isolating the individual QB's contribution than if we look at total passing yards alone.
Here are the leaders in AY for the 2011 regular season. The table is sorted by default according to Air Yards per Attempt (AirYPA), but you can re-sort the table by clicking on the column headers.
How Much Does A Win Cost?
I looked at salary data from 2000 through 2009 courtesy of USA Today and compared it with stats like Win Probability Added (WPA) and Expected Points Added (EPA). For those not familiar, WPA measures the impact a player has on his team's fortunes in terms of wins. EPA measure his impact in terms of net point differential. I looked at other stats too, but EPA and WPA fit very nicely with salary, at least for QBs.
Specifically, I wanted to discover what teams are willing to pay in exchange for expected levels of performance. To find out, I plotted the salary cap values of QBs against their performance. First, I made an adjustment for year. Between 2000 and 2009, QB salaries have steadily increased. By 2009, they were about double what they were to start the decade. This fits nicely with overall team cap numbers, which approximately doubled between 2000 and 2009.
QB performance has inflated too, but I haven't yet added a correction. QB performance has increased a total of about 10% since 2000, which pales in comparison to salary. In the future I'll add a correction and it might sweeten up the results a bit.
NFL contracts are notoriously complex, with signing bonuses, guarantees for both performance and injury, roster bonuses, and performance incentives. But none of that matters to me. I just want to know how much of a team's payroll under the cap--its most precious resource--is it willing to spend. How much are they spending, and how much are they getting back? For now, I'm looking at all big-money players, whether they're draft picks or free agents.
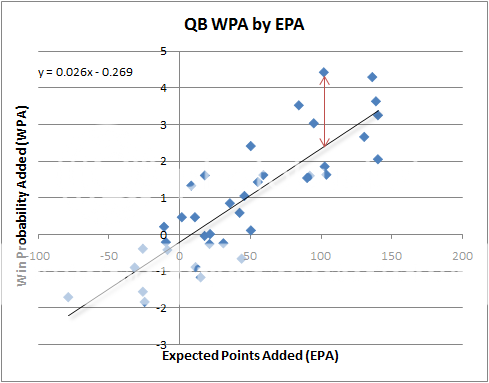
Here is how the relationship between salary and performance shakes out. The top graph plots EPA vs. cap hit, and the second graph plots WPA vs. cap hit broken out by season. The plot filters out QBs that earned less than approximately $2M in adjusted salary.
Carson Palmer on the Back of an Envelope
Palmer is good QB, but he was what people call ‘elite’ for only one season, his second year which ended with that unfortunate knee injury in the playoffs. A lot of people say that since the injury, “he hasn’t been the same.” Perhaps the injury is the cause, but maybe he simply caught lightning in a bottle in 2005. Either way, how he performs as Jason Campbell’s replacement in Oakland is going to be fairly unpredictable. There are lots of considerations on both sides of the ledger—new team, out of practice, same system, familiar coach, etc. One thing we can be sure of, however, is that he’s going to be better than Kyle Boller.
Let’s take a quick look at Palmer’s career numbers to see where his typical level of performance slots among QBs in 2011.
QB Rating and Context
One of the biggest storylines of this early 2011 season is the obvious offensive explosion that has occurred, especially when it comes to quarterback play. Three QBs have already thrown for over 1000 yards, and nine quarterbacks are averaging over 300 yards per game through the air, and it doesn’t stop there. Of the 32 quarterbacks considered to be “qualified,” 23 of them have a standard QB Rating over 80. Eight signal callers currently sit above the 100 mark, and almost half of the leagues field generals come in over 90.
When QBs are universally playing out of their minds, how do we tell who’s really standing out and taking hold of the league? When league averages shift and context changes, we have to account for it in the way we evaluate players. If it’s easier to find a QB who can post a 90 rating then ever before, than those passers with ratings in the eighties aren’t so special any more. If you’re not convinced that we need to start comparing players to each other instead of just to the QB Rating metric, here is a chart that should change your mind.
How Many Wins Is Manning Really Worth?
Win Probability Added (WPA) can't do everything, but one of the things it can do extremely well is tell us exactly how much of every win or loss was due to one component of a team. In this case, it can tell us how many wins the Peyton Manning passing game can account for. Although we can't really separate Manning from his blockers and receivers, we can nail down a hard number for the Colts passing game as a whole, of which Manning has been the central fixture.
Since 2000 (as far back as my data goes), Manning played in 176 regular-season games and accumulated a total of 43.0 WPA, for an average of 3.8 WPA per season. This equates to 0.24 WPA per game, which means that Manning (and his passing offense) would give an otherwise perfectly average team a 74% chance of winning a game. In other words, he would take an 8-win team and make them an 11.8-win team.
How Quarterbacks Age
It's a much more difficult question than it first seems. Averaging the performance of all the recent QBs by age doesn't work. A survivor bias ensures that only the successful QBs stay in the league long enough to have their stats in the sample. Another complication is the the steady inflation of passing stats over the years. In this post, I'll try to tackle those problems to better understand how QB performance is affected by age.
ESPN's New QB Stat
ESPN has a talented new analytics team, and their first foray into football is their Total QB Rating. It seems the first thing anyone does when they get into advanced football stats is to create their own QB rating system. The QBR is a major improvement over the NFL's traditional passer rating, and there are a lot of things I like about it, but it's not perfect. I'll try to summarize my understanding of the stat, and then I'll list the things I like about it and the things I don't like so much. As we say in the fighter pilot business--the goods and others.
According to ESPN's own explanation, the stat is based on three primary concepts--Expected Points, Win Probability, and division of credit. As I understand it, QBR begins with a QB's Expected Points Added for each play in which he was directly involved, including both pass plays and runs. It modifies each play's EPA value according to a clutch factor, which is based on Win Probability (WP). Here, I use something similar known as Leverage Index (LI). LI is the ratio of the potential swing in WP for a play compared to the average play's potential swing in WP. For example, an LI of 3 means that a play is 3 times more critical to a game's outcome than the typical NFL play. (You can find any play's LI on the interactive WP graphs here by hovering your cursor over the graph. I still consider it a 'beta' stat because I haven't settled on a final, single definition of potential success and failure for every play.)
Who's 'Clutch' in 2010?
Two of the most clutch QBs of 2010 face off tonight as the Falcons host the Saints. Although 'clutch' performance may not be a persistent skill in players, there undoubtedly exists clutch play itself. Due to the varying leverage created by the combination of score and time, some players will have their better moments when they matter most, and some players will have their worst moments at just the wrong time.
Here's one way to measure which QBs are most 'clutch' this season. WPA accounts for the leverage of score and time while EPA ignores it. We can plot each QB's Win Probability Added (WPA) against his Expected Points Added (EPA), creating a baseline expected WPA for each QB.
2010 Koko Fantasy Rankings - QBs
It's that time of year. I suppose some of you have been running mock drafts for weeks already, but for the rest of us it's just now time to start thinking about our 2010 fantasy roster. The first installment of the Koko rankings is for QBs.
These projections are intended to establish the baseline minimum accuracy as the most reasonably naive predictions. The general explanation of the system along with details of the regression plots can be found in the 2010 QB post.
2009 Final Quarterback WPA and EPA
Here are the final numbers for quarterback Win Probability Added (WPA) and Expected Points Added (EPA) for the 2009 season. These numbers include playoff performance. I've posted these stats previously for selected players, but this is the first time I've published a comprehensive list. This is the first time I've truly had confidence in the absolute values of the WPA stats. Previously, they really could only be relied on for relative comparisons between players.
Is Kurt Warner a Hall of Famer? What Does WPA Say?
Kurt Warner announced his retirement Friday, and his Hall of Fame credentials have been a topic of conversation. Everyone is familiar with his career: three Super Bowl appearances, one ring, two MVP awards, and a compelling personal story that inspires grocery stock clerks around the country.
According to Pro-Football-Reference, his career Adjusted Net Yards Per Pass Attempt (net passing efficiency minus 45 yards for each interception and with a 20-yard bonus for each TD pass) is 6.7 ANY/A. That's very, very good, and it puts him in league with the era's best passers. But it's not called the Hall of Efficiency; it's the Hall of Fame.
With that in mind, we turn to Win Probability Added (WPA), a narrative stat uniquely suited for measuring performance in terms of how each play helps a team win or lose. Fame is about a lot of things, but it's primarily about wins, so let's see what WPA has to say.
The 2009 All-WPA Team
The day after the Pro Bowl rosters are announced there are the obligatory "snub" articles in local papers around the country. In the DC area, the annual London Fletcher snub article is simply reprinted from last year's Post. So what about those Vincent Jacksons and Cedric Bensons who were unfairly left off the roster in favor of big name stars who may not have had a particularly good year? Who really earned their ticket to Miami?
I'll compare players using two different stats. Win Probability Added (WPA) measures each play's increase or decrease in a team's chances of winning. For every play that a player is mentioned in the play-by-play description, including penalties, turnovers and everything else, the WPA is tallied in his name. WPA is a narrative stat. It tells the story of what happened and is very context-dependent. It measures performance when it matters most. It has limited applications in terms of predicting future player performance, but it my mind it's perfect for comparing Pro Bowl and MVP contenders--even Hall of Fame candidates once there's enough data.
JaMarcus Russell: Concorde of the NFL
With Jamarcus Russel’s recent benching, there’s been a lot of talk about when it’s time for a team to cut its losses on a failed quarterback. I don’t have hard numbers at my fingertips, but I’d be fairly certain that if a QB isn’t playing above average football or there hasn’t been steady improvement, by the end of his second year, it’s time to move on. [Edit: Here's a good look at that very question at PFR.] There’s no question teams tend to stick with struggling QBs well beyond their expiration date, even when better alternatives exist. The real question is, why?
Let’s say you’re an out-of-town Bills fan, and before the season began you were understandably optimistic about the team’s prospects. You bought prime tickets to the January 3rd game hosting the Colts, including parking and a hotel room. Altogether the bill comes to $400. In August, this feels like a great deal.
As the season wears on, it becomes clear the Bills aren’t contenders. The coach is fired, and the upcoming Colts game is not looking promising, as the Colts appear likely be playing for home field advantage in the playoffs. Everything points toward a humiliating blowout. What’s worse, as the game approaches the weather isn’t looking good. Bills fans are always the hardy type, but the foercast is beyond bad—snow, wind, freezing rain, and bitter cold. You’re not exactly excited about the prospect of going to the game.
Thanks for the Memories, Brett
With Brett Favre’s recent non-un-retirement making news, I thought I’d take a look back at some of his best plays. I know I’ve been critical of Favre during his comeback year, but to be honest, I truly respect his play. How could you not? What I really didn't like was the fawning media, which overlooked every indication he was nothing close to his old self. Still, the bottom line is that he was a great competitor and most of all a winner.
And what better way to measure a winner than to directly measure his contribution to his team’s chances of winning with a stat like win probability (WP)? Every play in a game has an effect on the WP, whether it’s +1% or -20%. We can sum up the WP for all the plays a player has been a part of, and we can get some idea of his overall contribution to his team’s efforts. For a specific play, or for a specific player, this is ‘win probability added’ (WPA).
I’ll use WPA to go back through the database and pull out Favre’s most heroic plays. Unfortunately, the data only go back through 2000, after some of Favre’s peak years. But it is still a neat way to demonstrate some of the interesting things we can do with WPA, and it hints at some of its future applications in football.
The table below lists Favre’s twelve plays with the biggest impacts.Date WPA Opp Dn-Dist-Fld Pos Lead W/L Qtr Play Description 10/29/2007 0.55 DEN 1-10 OWN 18 0 W OT (14:56) 4-B.Favre pass deep left to 85-G.Jennings for 82 yards TOUCHDOWN. 9/23/2007 0.53 SD 2-10 OWN 43 -4 W 4 (2:13) (Shotgun) 4-B.Favre pass short left to 85-G.Jennings for 57 yards TOUCHDOWN. 10/7/2001 0.49 TB 2-3 TB 38 -4 L 4 (1:19) (Shotgun) 4-B.Favre pass to 30-A.Green to TB 13 for 25 yards (59-J.Duncan). screen right 12/8/2002 0.34 MIN 3-13 MIN 40 -9 W 4 (10:58) (Shotgun) 4-B.Favre pass to 89-R.Ferguson for 40 yards TOUCHDOWN. 11/14/2004 0.33 MIN 2-10 OWN 46 0 W 4 (1:05) 4-B.Favre pass to 40-T.Fisher to MIN 29 for 25 yards (21-C.Chavous). 10/17/2004 0.32 MIN 3-10 OWN 16 -7 L 4 (12:07) (Shotgun) 4-B.Favre pass to 80-D.Driver for 84 yards TOUCHDOWN. 11/4/2007 0.31 KC 2-10 OWN 40 -6 W 4 (3:13) (Shotgun) 4-B.Favre pass deep middle to 85-G.Jennings for 60 yards TOUCHDOWN. 11/6/2000 0.31 MIN 3-4 MIN 43 0 W OT (11:33) B.Favre pass to A.Freeman for 43 yards TOUCHDOWN. Play Challenged by Review Assistant and Upheld. 10/26/2008 0.30 KC 2-5 KC 15 -3 W 4 (1:05) (Shotgun) 4-B.Favre pass short left to 87-L.Coles for 15 yards TOUCHDOWN. 12/21/2006 0.30 MIN 2-6 OWN 37 -1 W 4 (4:05) 4-B.Favre pass deep right to 82-R.Martin to MIN 27 for 36 yards (26-A.Winfield). 12/10/2000 0.28 DET 3-8 DET 49 2 W 4 (5:50) B.Favre pass to B.Schroeder pushed ob at DET 4 for 45 yards (J.Brown). 1/11/2004 0.26 PHI 1-10 OWN 49 0 L 4 (12:22) 4-B.Favre pass to 84-J.Walker to PHI 7 for 44 yards (21-B.Taylor).
What stands out to me is that 6 of the top 10 plays were against his almost-current team, the Minnesota Vikings. Also, not all of them were touchdown plays. Many were simply critical first down plays late in tight games. I remember the #1 play well because 2007 was when Favre was my fantasy QB, and that game against the Broncos was a nationally televised game.
Of course, there were receivers and blockers making the plays too. I can’t separate the individual contributions to each play. Still, the list is a handy way to start looking for great plays.
I know what all the Favre critics are wondering, and I was wondering the same thing. I couldn’t help it. Below are his twelve worst plays. The same caveat applies—the bust could be on a receiver or blocker, and not Favre himself. And let’s not forget that the other team gets paid too.Date WPA Opp Dn-Dist-Fld Pos Lead W/L Qtr Play Description 10/26/2008 -0.61 KC 3-2 KC 8 4 W 4 (9:29) (Shotgun) 4-B.Favre pass short middle intended for 83-C.Stuckey INTERCEPTED by 24-B.Flowers at KC 9. 24-B.Flowers for 91 yards TOUCHDOWN. 10/8/2006 -0.54 SL 2-10 SL 11 -3 L 4 (:44) (Shotgun) 4-B.Favre sacked at SL 18 for -7 yards (91-L.Little). FUMBLES (91-L.Little) touched at SL 15 RECOVERED by SL-23-J.Butler at SL 13. 23-J.Butler to SL 13 for no gain (63-S.Wells). 10/7/2001 -0.43 TB 1-6 TB 6 0 L 2 (15:00) 4-B.Favre pass intended for 88-B.Franks INTERCEPTED by 53-S.Quarles at TB 2. 53-S.Quarles for 98 yards TOUCHDOWN. 12/4/2005 -0.41 CHI 1-7 CHI 7 1 L 2 (:24) (Shotgun) 4-B.Favre pass intended for 89-R.Ferguson INTERCEPTED by 33-C.Tillman at CHI -2. 33-C.Tillman pushed ob at GB 7 for 95 yards (40-T.Fisher). 12/24/2000 -0.41 TB 2-10 TB 34 0 W 4 (1:54) B.Favre pass intended for C.Lee INTERCEPTED by J.Duncan at TB 28. J.Duncan to TB 43 for 15 yards (A.Green). 12/21/2006 -0.39 MIN 1-10 OWN 40 6 W 3 (5:19) (Shotgun) 4-B.Favre pass short left intended for 85-G.Jennings INTERCEPTED by 21-F.Smoot at GB 47. 21-F.Smoot for 47 yards TOUCHDOWN. 1/11/2004 -0.38 PHI 1-11 OWN 32 0 L OT (13:12) 4-B.Favre pass intended for 84-J.Walker INTERCEPTED by 20-B.Dawkins at PHI 31. 20-B.Dawkins to GB 34 for 35 yards (30-A.Green). 11/24/2002 -0.38 TB 1-12 OWN 26 1 L 3 (7:27) 4-B.Favre pass intended for 83-T.Glenn INTERCEPTED by 25-B.Kelly at GB 49. 25-B.Kelly ran ob at GB 18 for 31 yards (30-A.Green). 12/24/2004 -0.37 MIN 3-4 OWN 7 0 W 4 (8:31) 4-B.Favre pass intended for 84-J.Walker INTERCEPTED by 55-C.Claiborne at GB 15. 55-C.Claiborne for 15 yards TOUCHDOWN. 9/17/2006 -0.36 NO 1-7 NO 7 -1 L 3 (7:57) 4-B.Favre pass short right intended for 33-W.Henderson INTERCEPTED by 23-O.Stoutmire [55-S.Fujita] at NO -1. Touchback. 1/20/2008 -0.35 NYG 2-8 NYG 8 0 L OT (14:13) 4-B.Favre pass short right intended for 80-D.Driver INTERCEPTED by 23-C.Webster at GB 43. 23-C.Webster to GB 34 for 9 yards (80-D.Driver). 9/9/2007 -0.34 PHI 3-7 PHI 7 0 W 4 (4:26) 4-B.Favre sacked at GB 43 for -9 yards (58-T.Cole). FUMBLES (58-T.Cole) RECOVERED by PHI-93-J.Kearse at GB 38. 93-J.Kearse to GB 38 for no gain (76-C.Clifton).
WPA takes into account the context within the game, but it does not account for the context around the game. In other words, it treats the overtime interception against the Giants in the NFC Championship game in 2008 the same as if the game were in September. I don't blame him for not wanting that to have been his last play.