

NFL coaches typically adhere to what's known as the Vermeil Chart for making two-point decisions. The chart was created by Dick Vermeil when he was offensive coordinator for UCLA over 40 years ago. It's a very simple chart that simply looks at score difference prior to any conversion attempt and does not consider time remaining, with one caveat. It applies only when the coach expects there to be three or fewer (meaningful) possessions left in the game.
With just over 7 minutes to play, there could be three possessions at most left, especially considering that at least one of those possessions would need to be a KC scoring drive for any of this to matter. (In actuality, there were only two possessions left, one for each team.) Even the tried-and-true Vermeil chart says go for two when trailing by 5. But it's not the 1970s any more and this isn't college ball, so let's apply the numbers and create a better way of analyzing go-for-two decisions.
Except for rare exceptions I've resisted analyzing two-point conversion decisions with the Win Probability model because, as will become apparent, the analysis is particularly susceptible to noise. Now that we've got the new model, noise is extremely low, and I'm confident the model is more than up to the task.
First, let's walk through the possibilities for KC intuitively. If KC fails to score again or DEN gets a TD, none of this matters. Otherwise:
Kick the XP:
- if DEN doesn't score, need a TD to win
- if DEN scores a FG, need a TD to tie
Two-point fail:
- if DEN doesn't score, need a TD to win
- if DEN scores a FG, need a TD plus a two-point conversion to tie
Two-point success:
- if DEN doesn't score, need a FG to tie, TD to win
- if DEN scores a FG, need a TD to win
Every permutation but one points in favor of going for two. Only the scenario where DEN gets a FG does it hurt to go for two, and even then KC can still achieve the tie with a second two-point conversion. But we can go around in circles all day debating what-ifs and what counts as a "meaningful" possession. What does the model say?
Let's find the breakeven probability of success that would make the conversion attempt worthwhile. If the breakeven is below the typical success rate of just over 45%, it would generally be a good idea to go for two.
A few definitions:
B = the breakeven probability of success
XP = KC's win probability by kicking the extra point
S = KC's win probability after a successful conversion
F = KC's win probability after a failed conversion
Setting the WP for kicking the XP equal to the 'lottery' of going for two, we get:
XP = B * S + (1 - B) * F
Solving for B gives us:
B = (XP - F) / (S - F)
In other words, the breakeven probability is the ratio of two differences of win probabilities: the difference between the XP and a failed conversion, and the difference between a successful conversion and a failed conversion. This makes intuitive sense because as the benefit of the XP diminishes, the breakeven gets lower. And as the benefit of a successful conversion decreases, the breakeven gets higher.
Just the smallest bit of statistical noise can hurt the analysis. When either of the differences mentioned above are very small, the breakeven probability can swing wildly. Noisy inputs can make the denominator very small, creating very large leverage in the result. Fortunately, with new more advanced modeling techniques WP 2.0 offers, we can get smooth, stable results as the chart below will illustrate.
In KC's situation, the numbers look like this:
XP = 0.273
S = 0.328
F = 0.250
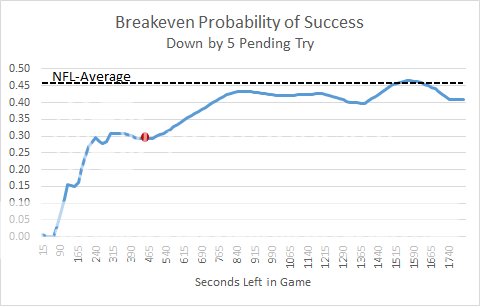
Putting those numbers through the meat grinder gives us a breakeven of 32%, much lower than the league-wide average of 45%+. So the model supports the Vermeil chart (in this case) as well as our intuition. It also agrees with the Krasker chart [link currently down] and the Sackrowitz chart.
Here is what the breakeven probability success is for a score difference of -5 points throughout the second half. As you can see it's almost always below the league average rate, and plummets in the end-game. Krasker and Sackrowitz both agree on this result as well. The red dot indicates the KC-DEN scenario.
A couple final notes.
1. What eventually happened is the only thing that really makes a failed conversion attempt costly: DEN kicked a field goal on their last possession. Don't be suckered into thinking that makes the XP the right decision. You can only evaluate decisions based on the information available at the time.
2. The difference in terms of absolute WP between the XP and the conversion attempt was only 1.2 percentage points. You might think that's tiny, and in the grand scheme you'd be right. But coaches stay up watching film until their eyes bleed, looking for every last 0.1% edge. It's not a good idea to toss away a percentage point here and a percentage point there. Analyses like this might only matter 1 or 2%, but they add up fast, even in a single game. And before you know it, you can turn a 7-win team into a playoff team, just with some better decisions.
3. I've created a complete model for two-point conversions, covering every possible scenario including timeout considerations. Hopefully, there will be some interesting situations to look at this season!


Can your model take into account John Fox not calling timeouts at the end of the game to give his offense a chance in case KC scored? I don't understand why he didn't do that considering he has Peyton Manning and he is at mile high so the long FG has a better chance of succeeding.
I'm mildly surprised at the discrepancy between XP and S (either that or I have a hard time internalizing just how big the difference between 32.8% and 27.3% is). I remember from playing around with the WP model last year that being down 3 isn't always better than being down 4 with the ball near the end of the game (where "always" depends on the time remaining). I just tested one case (2 minutes remaining, with ball on own 20) and down 3 gives 17% win percentage and down 4 gives 22%. The intuitive explanation would be that teams play suboptimally down 3 on offense and up 4 on defense (offenses down 3 too often settle for the field goal, and defenses up 4 are too afraid of the big play than normal and let offenses march down the field). Now, this reverses when the time remaining increases beyond 4 minutes or so, and possible explanation would be that the other team often would have a possession of their own (during which they'll be more urgent to score when down than when tied, so settling for a field goal isn't as bad relatively speaking). It appears that the time remaining may indeed be a much more significant variable in this decision than one might expect. I'm not sure which parameters you used for the numbers you got, Brian, and I'm of course still using WP Model 1, but lowering the time remaining from 7:15 to 5:15, for example, actually makes it such that KC would have a higher win % being down 4 than down 3. All of this obviously assumes the average historical teams are playing (and most importantly, the average coaches and QB's), but I'm not sure this specific matchup is much different from the norm. John Fox is notoriously conservative (which would mean the scoring margin would have a larger impact on how optimally he plays) and how good Manning is shouldn't matter much since if the Broncos score a TD, the game is over regardless. Do you get the same result using WP Model 2?
I'd love to see this in the up 5 scenario. Bruce Arians has been all about the 2 PT conversion this season and in yesterday's Giants game he made the call to go for 2 up 5. Would love to see why that was the right/wrong play. Feels right to me.
Up 5 you should go for 2 pretty much all the time. I need to look to be sure, but probably well into the 1st half.
I remember years ago when the 2PC option was introduced for the NFL comment about how it would add another layer of complication and decision making for coaches, quite apart from the effects of other tinkering such as WR/CB contact close to the LofS and more fundamentally, timing adjustments with the 40/25sec PC.
Coaches hate being "trapped" in the situation of leading by six points: early enough in the game there is the prospect of another FG stretching the lead to nine, but early is early is like how long is a piece of string!
This is why Safety scores create such havoc with potential differences; ahead by five a Safety boosts a five point lead to a full TD exactly as a successful 2XP would do, but if it fails a later FG would boost to eight.
I managed to see most of the 49ers-Bears game. Mentally, or rather fundamentally, the 49ers lost the game after that Q3 time-consuming drive that only led to a FG and a 13 point lead, which may have looked good at the time from a WP prospective especially at home, but vulnerable nevertheless
Running the Ball for Two Points is a Wiser Choice than Kicking a PAT.
Current stats ~ 99% success rate for kicks = .99 points per attempt. 56% rate for runs = 1.12 points per attempt. Pass rate= 44%/.88 pts per attempt.