Showing posts with label kickers. Show all posts

Washington Post: Was Cunfiff's 62-Yard FG Attempt Wise?

This week's article at the Post looks at whether the numbers favored the Redskins' 62-yd FG attempt or going for a conversion after Josh Morgan's insanely stupid unsportsmanlike penalty call.

After every game, each NFL coaching staff evaluates the performance of players on each and every play. Coaches also grade themselves on play selection and other decisions, such as challenges, clock management and fourth down decisions. The Redskins staff should take a hard look at the final decision of Sunday’s game to attempt a 62-yard field goal rather than try to convert a 4th and 16...

...There isn’t the luxury of time and a computer full of stats on the sideline during a game, so it’s hard to fault the Redskins’ coaches. The value of analyses like this one is not to prove there is always a right or wrong answer, but to recalibrate a coach’s intuition so that he’s armed with the best information next time.

Mike Shanahan disagrees with me, but he is wrong. Already the post has hundreds more comments than their typical post gets, so it seems it struck a nerve. The comments there have come a long way from a couple years ago, but a quick scan of them tells me most of them miss the point.

By the way, these posts now appear in the print version of the Sunday Post each week.

Kickers Are Getting Better and Better

This past Sunday we saw the all time FG distance record tied for the second time in a year. And it wasn't indoors or even in Denver. I've previously written about how FG accuracy has improved even as attempt distances have increased., but even in the last few years kicking accuracy at long distances has improved significantly. This trend shows no sign of slowing, and it has significant implications for the sport.

In an analysis of the previous overtime format, I noted the following:

In 1974, the league FG% was 60.6%. This year, it was 84.5%. And that even masks how much kickers have truly improved. In 1974, 36% of all FG attempts were from 40 yards or beyond. In 2008, the figure was 41%. These days, teams aren’t looking to get inside the 25 for a field goal attempt, they’re just hoping to get inside the 40. Getting a quick score in overtime has become a far easier proposition. Field goals have gradually warped NFL football. In 1974, there were 3.0 FG attempts each game compared to 3.9 in 2008, a 30% increase.

Temperature and Field Goals

As a pilot, I'm familiar with the effects of weather on things hurtling through the air. Many people intuitively sense hot, humid air as thicker and heavier, but the opposite is true. Warm air, as we all learned in 5th grade, is less dense than cold air. And the water molecules that make air humid, for some reason I've long forgotten, actually spread all the other molecules out, creating even thinner air. Aviators are wary of the Four H's--hot, humid, high (elevation), and heavy--things that can drastically alter performance and make takeoffs and landings a challenge.

Planes, and jet planes in particular, love cold dry air. The dense air helps engines work efficiently, and it helps the wings produce lift, making for shorter takeoffs and slower landing speeds. Baseballs, on the other hand, love the Four H's. Fans of our national pastime are well aware of the fact that home run rates peak in the hottest months of the season, and that balls tend to fly out of the park in Colorado.

Field goal kicks are affected by the same factors as anything else flying through the air--wind, temperature, and even altitude. In this post, we'll take a look at how temperature affects field goal success.

Kicker Billy Cundiff Had 20 Sacks This Year

Last Sunday Baltimore's kicker Billy Cundiff tied the NFL regular season record for the most touchbacks with 40. That's over a 50% touchback rate. How big of an advantage did this give the Ravens? Well, the title says it all. I could also say he would be as valuable as the 7th best running back in the league.

The occasion seemed like a good excuse to repost part of an article from last year that measured the value of a touchback:

It's Blocked!

How often are field goal attempts blocked? And how does the rate vary by attempt distance?

I received a few requests to answer those questions after Monday night's field goal block for a touchdown return by the Patriots. It would also be a consideration in the final seconds of the Colts-Jaguars game Sunday afternoon.

Shane Lechler is Overrated...Or Is He?

I've been waiting for a good opportunity to write this article for a while. Recently, Carl Bialik at the WSJ asked me to take a look at some punting stats for a post on the 'Golden Age of Punting.' For the last few years, Shane Lechler has been lauded for his super-human punting ability.  For three of the last six years he's led the league in total punting yards, and for five of the last seven years he's lead the league in yards per punt. He'll be going to his fourth pro-bowl in a few weeks.

But, there's a problem with all those gaudy stats. Lechler has the benefit of playing for the Oakland Raiders, who for the last few seasons have fielded a terrible offense. Lechler, more than most other punters, gets to punt from deep in his own territory where the chance of a touchback doesn't shorten punts. We can call this the JaMarcus Effect.

In this post, I'll look at where Lechler's average field position is compared to the rest of the league. We'll see that this has a big effect on punt distances. But we'll also see that I'm wrong about Lechler in the end. Despite this unfair advantage, he's still the NFL's best.

Does FG Accuracy Decline In Clutch Situations?

Like most other Baltimore fans, I was disappointed at the end of the most recent Ravens game when kicker Steve Hauschka missed a 44-yard field goal that would have capped a dramatic comeback. What made it worse was that I had to suffer through the usual nonsense from the local sportswriters about how Matt Stover, the popular long-time Ravens kicker until released this year, would have undoubtedly made that kick.

The jury is certainly still out on whether Hauschka is any good, but let's keep one thing in mind. NFL kickers as a whole only make kicks from that distance 70% of the time(including blocks). We simply don't remember all the missed field goals in the first quarter, or when our favorite team is already 17 points ahead or behind. The ever-clutch Stover? His career accuracy from that range was...70%.

But then I wondered whether FG kickers are affected by the game situation. Do their nerves get rattled? Are kickers less accurate in clutch situations when the game is on the line?

The Value of a Touchback

This season will be the first that the Baltimore Ravens will start the year without place kicker Matt Stover. Stover has been a reliable fixture for the franchise for its entire existence. He's known for his reliable medium-range accuracy, but his field goal range and, possibly more importantly, his kickoff distance dwindled in recent years. Last year's kickoff specialist Steven Hauschka will now take over as the full-time field goal kicker.

Keeping a kickoff specialist on the roster has become somewhat fashionable in the NFL, but I'm not sure when the trend started or exactly how many teams do it. It's an expensive thing to do, not just in terms of salary, but in terms of a roster spot too. If you've read John Feinstein's Next Man Up, you know how precious every spot is for the coaches, and how difficult the weekly decisions are about who to dress for each game. A kick-off specialist is a costly luxury.

But maybe we're thinking about this backwards. Maybe we should ask whether it's worth it to have a field goal specialist.

Assessing FG Accuracy

It's been shown here and elsewhere that FG kickers are very hard to tell apart from one another. I have no doubt that it takes great skill and countless hours of dedication be as good as NFL kickers are. However, almost all kickers at the professional level can be considered statistically as accurate as any other.

By "statistically accurate" I mean that accounting for small sample size, environmental variables, and attempt distance, it is virtually impossible to tell one kicker apart from another. A kicker who is highly accurate one year is not likely to be as accurate the next. A big part of this variability in accuracy can be attributed to what's known as 'sample error.'

Typically, NFL FG kickers have between 30 and 40 attempts in a season. Think of baseball batters' averages after only 40 at bats, which would be about 8-10 games into the season. By this point some replacement-level guys are batting .500, and some future Hall of Fame sluggers are batting .100. But absolutely no one thinks the batters are truly .500 or .100 hitters. It's just a matter of a small statistical sample, which makes it impossible to really assess individual batting skill. And if batting had a wrinkle similar to FG attempt distance, it would be even harder to assess skill.

To me, it's absolutely laughable that some teams' kicker jobs are decided by pre-season contests based on maybe 4 or 5 attempts per kicker. I can only hope that coaches are really making these decisions based on many more attempts in practice.

The point is that we need dozens and dozens of attempts, from various distances and in various conditions, just to begin to be able to tell one FG kicker apart from another. And I bet that if we actually could tell good kickers from lesser ones, a very large part of the difference would be due to range.


So if range is important to both kinds of kicks, wouldn't a team prefer the guy with the deeper kickoffs? Plus, range is something we can actually measure. I can't definitively prove my point of view in a single post, but I can begin to look at some aspects of the value of deep kickoffs. In this post, I'll look at the value of something I think is often overlooked: the touchback.

The Value of a Touchback

About 10% of all NFL kickoffs (not including onside kicks) are touchbacks. Forcing the opponent to start at their own 20 doesn't exactly seem like a death blow, but it is modestly valuable.

The average starting position following all kickoffs (including penalties on the play) is the 30 yd line. But the average starting position for all non-touchback kickoffs is the 32. The difference between a touchback an non-touchback is 12 yds. If the 32 seems a little far down the field to you (like it does to me), it's because the median starting field position for non-touchbacks is the 27 yd line.

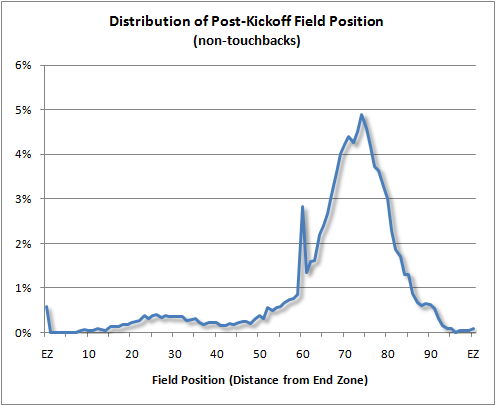
Here is the distribution of starting field position for non-touchback kicks.


[A couple of interesting notes. First, the spike at the 60 (a team's own 40 yd line) is from kicks out of bounds. Second, I think it's interesting that of long returns, there are many more that make it to the opponent's 30 or 20 or so than make it only to just past midfield. Then, if a returner makes it past the 20, he's probably going to make it all the way to the end zone.]

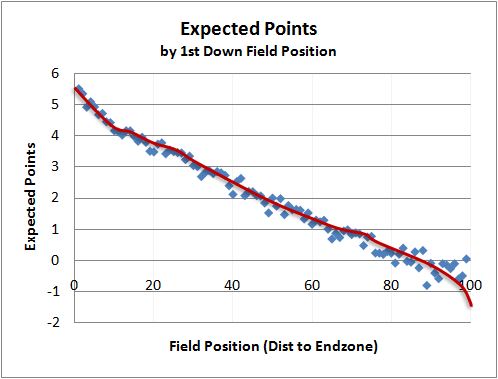
Back to touchbacks. Using the concept of Expected Points (EP), the average point value of a first down at each field position(see graph below), we can estimate the nominal value of a touchback. The 20 yd line represents 0.1 EP, and the weighted average of the distribution of non-touchback field position is 0.9 EP. That's a value of 0.8 EP per touchback. (This includes turnovers and penalties.)

Sacks are worth 1.7 EP, so a touchback could be considered the equivalent of about half a sack.


An alternative way of thinking of those 12 yards is to think of them as one additional first down required for a team to score. It's one more first down the offense will need to either score a TD or get into FG range. The average first down conversion rate in the NFL is 67%, so a touchback turns a TD drive into a FG drive or a FG drive into a punt 33% of the time.

We can also use the concept of win probability to asses the value of a touchback. Over the past 9 seasons, non-touchback kicks average a change of 0.002 in WP. Touchback kicks average an increase of 0.01 WP. The net value of a touchback is therefore an increase in 0.008 WP, or about 1%. One percent isn't much at all, but with about 5 kickoffs per game for each team, the effect can add up.

The WP added (WPA) of any given kickoff depends on the leverage of its particular game situation. With the game close and time dwindling, a touchback or deep kick can make a 2-minute offense that much harder for the offense.

The biggest two touchbacks in my database (going back to 2000) were each for 0.13 WPA. Kicker Steve Lindsay, who played only two seasons in the NFL, was picked up by Denver from Jacksonville halfway through the 2000 season. With the Broncos Trailing 37-31 to the Chargers and 4:05 left in the 4th quarter, Lindsay boomed the touchback heard 'round the world (not exactly--but it should have been.) Field position in this situation was critical. A FG by San Diego would have clinched the game, and Denver needed the ball back in as good field position as possible. As fate would have it, the Broncos went on to win the game 38-37.

Arizona kicker Neil Rackers owns the other touchback of the decade. In a 2007 game against Seattle, tied 20-20 with 4:53 remaining in the 4th, Rackers' touchback made it that much more difficult for the Seahawks to put together a game-winning drive, and would have made Arizona's own drive that much easier. What actually happened was that Seattle fumbled on a 1st and 5 from the Arizona 36, allowing the Cards to put together a FG drive to win the game. Sure, the game turned on a turnover and not field position, but had Seattle found itself on the Arizona 24 and not the 36, maybe the play call would have been a little safer. We'll never know.

Anyway, those are my two nominations for the touchback hall of fame. It's not the most glamorous play in football, but it's certainly overlooked and worthy of examination.

Bad Overtime Logic and Good Kickers

One thing about the web is that you can tell what topics fans are genuinely interested in. This week there were many hits on the OT coin flip from people searching Google on the subject, and my article on the topic from September was bounced around fan message boards all over the country.

What Is Fair?

In my original article I point to the fact that in about 1 in 3 OT games, the coin flip winner scores before their opponent has a chance to go on offense. In total the coin flip winner wins 60% of all overtimes. At FO this week, they wrote “…only 60%...” as if that’s just a small edge.

I couldn’t disagree more. You could think, "50% is the optimally fair rate, and 60 is only 10 'more percent' than 50. Hey, 10% isn’t very much, so the coin flip is close enough to being fair. What’s the big deal?" But this is a flawed way of looking at it. Percent and percentage points are not the same thing.

Would you say that 3:2 odds represents a significant advantage? I sure would. That means that one team’s chances of winning are half again larger than the other’s. Well, that’s exactly what a 60% win-rate is—a 60/40 or 3:2 advantage. That can’t be ignored.

If you still don’t feel that a 3:2 advantage is unacceptable, what would be the odds at which you would say something needs to be fixed? 2:1? That would be a 67/33 split…and we’re “only 7%” away from that.

"They Had a Chance to Make a Stop"

One argument I frequently hear in defense of the status quo is "the defense had a chance to make a stop." True, even though one out of three OT games ends without one team ever touching the ball, the losing defense did have an opportunity to force a punt or turnover. On average they have a 2 in 3 chance of stopping the coin flip-winner from scoring. The problem with this argument is that the coin flip-winning defense would have a 100% chance of making a stop. The opposing offense will never take the field.

Even if the defense does manage to stop the coin flip-winning team from scoring, the advantage persists and cascades throughout the OT period. However the flow of the game shakes out, the best the coin flip-loser can do is break even in terms of possessions, and the worst the coin flip-winner can do is break even. In other words, if both teams are stopped from scoring on their first drives, the problem starts all over again.

Field Goals

Another point I made in my article was that a big part of the reason for the advantage was the movement of the kickoff spot from the 35 back to the 30 yard line. This had the unintended consequence of increasing the advantage of the receiving team in OT. Touchbacks became far less common and starting field position improved for offenses. But this is only part of the story.

The reason the NFL moved the kick off line back was because kickers had improved so much over the years, both in distance and accuracy. In 1974, the league FG% was 60.6%. This year, it was 84.5%. And that even masks how much kickers have truly improved. In 1974, 36% of all FG attempts were from 40 yards or beyond. In 2008, the figure was 41%.

These days, teams aren’t looking to get inside the 25 for a field goal attempt, they’re just hoping to get inside the 40. Getting a quick score in overtime has become a far easier proposition.

Field goals have gradually warped NFL football. In 1974, there were 3.0 FG attempts each game compared to 3.9 in 2008, a 30% increase. Kickers have become so accurate and kick such long distances that the sport has changed before our eyes. Overtime might be where the effect is magnified and most apparent, but the entire game is different.

Is it time to narrow the field goal posts?

Change extra points?

Reader Eddy Elfenbein makes a great point about extra points. I also like the idea of narrowing the field goal posts, something Bill Cowher advocated last Sunday. It would not only make extra points less certain, it would make fourth down conversion attempts more common and make overtime less susceptible to the 'lose the coin toss, never touch the ball' phenomenon.

Ideas like these really aren't that revolutionary. They would just be returning the game to its 'natural' balance. Kickers have become so accurate in recent decades that it has warped the game from its original intent. But NFL football has certainly evolved in many ways, and its unparalleled success makes tinkering with it a tough sell.

Extra points have become so automatic, I don't even pay attention. They're just going to be surrounded by commercials featuring that stiff Sprint CEO and the Bud Light drinkability girl in the green jersey. The only reason to watch them is when there is a possibility of a challenge on the touchdown.

Kicking field goals is such a peculiar and specialized thing. It has almost nothing to do with the rest of the sport but can be so decisive. It would be like getting extra runs in baseball by lacing up some skates and slapping a shoot-out shot after every home run.

2007 FG Kicker Ranking

There aren't many positions in team sports as lonely as the place kicker. Alone on the sidelines all game long, he's asked to make the game-winning field goal in overtime to send his team to the Super Bowl. Or maybe his head coach doesn't have enough faith in his leg to attempt a 48 yard try, and instead goes for it on 4th and 13 only to ultimately lose the Super Bowl by 3 points.

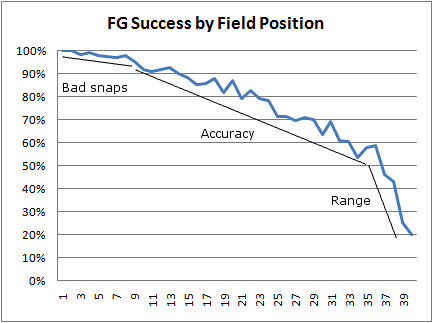
When we grade field goal kickers, we need to account for attempt distance and other factors. And attempt distance is complicated--it's non-linear. A 40 yard attempt is not twice as difficult as a 20 yd attempt. In fact, here is a graph of the average accuracy rates for field goals of various attempt distances.


So based on the analysis described here, I calculated the expected FG percentage for every NFL kicker based on his average attempt distance and home stadium environment. The difference between his actual FG% and his expected FG% can be considered his true performance given the difficulty of his attempts.

The table below lists all FG kickers from 2007 who had at least 10 attempts. It's sorted from best to worst. Click on the headers to resort as desired.


KickerTeamAvg Yds Att# AttActual FG%Exp FG%Act-Exp %
Feely36.62391839
Bironas36.7399081

9
Reed34.12592848
Nedney36.1198981

8
Graham33.43491856
Longwell41.22483776
Gould37.9368680

6
Brown38.3298680

6
Scobee33.51392866
Lindell35.02789836
Elam36.4318781

6
Andersen34.32889845
Kaeding35.12789845
Kasay35.9288682

4
Hanson38.7358380

3
Dawson34.13087843
Gostkowski32.92488852
Brown37.5348280

2
Suisham36.8358381

2
Stover35.23284832
Folk36.1318482

1
Bryant35.03385840
Tynes33.52785850
Carney32.91486850
Crosby38.2397980

0
Nugent35.5368182

-2

Janikowski42.7327275-3

Wilkins38.7327580

-5
Akers35.3327583-8
Rackers39.1307079-9
Vinatieri30.4297989-10
Rayner38.0226880

-11
Mare34.7195384-31


Congratulations to Jay Feely and the Dolphins, who at least have bragging rights to something in 2007. And jeez, what happened to Mare down in New Orleans? Only 19 attempts, but still that's significantly bad to say the least. Rackers seemed to have a down year. He was one of the top FG kickers over the last two years.

(Except for Mare) kickers are mostly bunched together in performance. Although according to raw accuracy percentage they appear separated by a wide disparity, in reality the difference in performance among field goal kickers is not large. In my previous analysis, I estimated that one stadard deviation in true accuracy is 7.7%. And for every standard deviation difference, a kicker would yield on average an additional 2.3 field goals worth 6.7 points in a season. Whether that's considered a lot or not depends on your perspective.

The Best Defensive Player in the NFL is...Neil Rackers?

My previous look at place kickers considered field goal kicking. Accounting for attempt distances and home field environment (dome, warm, etc.), I estimated that one standard deviation in FG kicking accuracy results in about 2.3 more successful FGs per season (worth 6.7 points). In this article, I'll look at kick offs and how they affect the ability of the opposing team to score.

Starting field position is obviously an important factor in scoring. The closer an offense is to scoring position, the fewer consecutive first downs are required to get there. A kicker who can kick deep can help his team by giving his defense more opportunities to force a punt or a turnover before his opponent is able to move into scoring position. Further, if the opposing offense is stopped, his offense will receive possession of the ball that much closer to scoring position on its own.

Kick off depth is easily measured, but the resulting field position is dependent on kick return and kick coverage performance. To isolate the performance of the kicker from the rest of the kick off squad, I ran a quick linear regression that estimates the expected resulting starting field position based on the depth of the kick. Average kick distances and return yards for each kicker (with >20 kick offs in a season) in the 2004-2006 seasons are plotted below. (Kicks that result in touchbacks are excluded at this point because there is no return. They will be factored back in later.)


We see that the deeper the kick, the longer the return. The longer a kick travels the more time and space the returner has to run before being met by the coverage team. Not every yard of extra kick distance translates into field position. About half of each marginal yard of kick distance is given back up in the return. If one kicker kicks 60 yd kicks, and another kicker kicks 70 yd kicks, the second kicker will only benefit by 5 yds of resulting field position after the average return.

Now we can calculate the expected resulting field position for each kicker in the NFL. Touchbacks are now factored back in. The expected starting field position of each kicker over the previous three seasons ranges from the 23.7 yd line to the 31.4 yd line. The average is the 27.4 yd line with a standard deviation of 1.49 yds.

Click on the table headers to sort.


KickerSeasonsKOsAvg DistTB PctExp Fld Pos
Neil Rackers320667.930.623.7
Michael Koenen214764.218.424.8
Paul Ernster17567.925.325.0
Olindo Mare318465.727.625.0
Josh Scobee322565.422.725.6
Kris Brown320164.414.925.8
Stephen Gostkowski18165.514.825.9
Todd Sauerbrun210060.011.326.2
Joe Nedney213260.28.626.3
Sebastian Janikowski319363.615.426.3
Jason Hanson320464.115.226.4
Micah Knorr16164.424.626.4
Jeff Wilkins323363.48.426.5
Wade Richey15363.113.226.5
Rob Bironas214163.214.926.5
Jay Feely324963.915.126.5
Mitch Berger28965.15.226.8
Phil Dawson319161.410.026.9
Aaron Elling27063.52.926.9
John Carney29561.64.727.0
Shaun Suisham12664.10.027.1
Billy Cundiff312263.16.227.1
Jose Cortez13863.910.527.3
Paul Edinger212859.10.027.4
Jason Baker12463.04.227.4
Adam Vinatieri324763.510.927.4
David Akers320464.312.027.5
Rian Lindell322159.74.627.5
Matt Bryant211962.57.627.6
Craig Hentrich17357.64.127.6
Josh Brown324663.18.927.6
John Kasay319462.15.428.1
Jeff Reed324461.66.528.2
Dave Rayner215463.38.328.2
Nate Kaeding327062.65.628.3
Lawrence Tynes326061.25.428.4
Robbie Gould214963.36.828.5
Matt Stover312861.36.728.6
Shayne Graham325761.56.728.6
Ryan Longwell321859.63.728.7
Toby Gowin17663.09.228.8
Todd Peterson16156.41.629.0
Mike Nugent213760.02.229.1
John Hall28160.72.729.3
Martin Gramatica24660.94.429.3
Jay Taylor12157.00.029.4
Steve Christie17157.72.829.7
Mike Vanderjagt27859.03.330.0
Nick Novak24458.82.131.4
Average2.214462.39.727.4


The Importance of Field Position

I think the best way to examine the football-significance of kickoff field position is to look at two contrasting cases. Let's compare the league's best kicker, Neil Rackers, with one of its recent "worst," Mike Vanderjagt, who was cut by the Cowboys last year. Racker's average expected field position was the 23.7 yd line and Vanderjagt's was the 30.0 yd line, a difference of 6.3 yds.

How important are those 6 yards? The field is 100 yds long, so are they 6% important? It's difficult to quantify, but here is one way to think of field position: In almost all cases, to move into scoring position, either for a TD or FG, an offense needs a consecutive number of first downs. The closer an offense is to scoring position, the fewer first downs it needs. In other words, lets think of a typical drive as a sequence of 1st downs instead of a sequence of plays.

In baseball, the game rests on the outcomes of at bats, not necessarily every ball and strike. Think of a series of downs as the equivalent of an at bat, and individual plays as pitches. We're not as interested in each pitch as we are with the outcome of the at bat. The analogy continues because to score in baseball, several consecutive successes (hits or walks) are usually required. In football, several first downs are usually needed to score. (And in both sports there is always the slim possibility of a home run/long pass or breakaway run.)

In the NFL, a successful first down yields 15 yards on average. So those 6 yards of field position mean that in 6 out of 15 cases, an opposing offense needs one additional first down more than they otherwise would need to score. That additional first down gives a defense one more opportunity to force a kick or a turnover. That additional first down could turn what would be a TD drive into a FG drive, or turn a FG drive into a scoreless one.

In any given series of 4 downs in the NFL, an offense succeeds in gaining another first down (or touchdown) 65% of the time. So defenses are able to interrupt the consecutive series of first downs 35% of the time. So 6 yds of deeper field position per kickoff reduces the probability the the offense will score.

(6 / 15) * 0.35 = 0.14 --> 6 yds of field position adds a 0.14 probability of interrupting a scoring drive.

(It was pointed out to me that series in the red zone are often more difficult because of the compression of the field, so not every series has an equal probability of success. That's true, however the red zone series happen on a TD drive whether or not the drive started on the 20 or the 40 yd line. The "extra series" that is sometimes required by a deep kickoff does not cause an additional red zone series. It would be on the front end of a drive and not in the red zone.)

Over the previous five years, NFL teams scored an average of 23.4 FGs and 34.6 offensive TDs per season, resulting in 312 pts per season. A 14% reduction equates to 43.7 point difference between Neil Rackers and Mike Vanderjagt.

312 * 0.14 = 43.7 pts per season

I know my favorite team sure could use an extra 43.7 points this season. Depending on how they are distributed, that would usually mean an extra win or two. However, only 37% of drives begin immediately following a kickoff. That would mean that the difference isn't really 43.7 pts per season, but:

0.37 * 43.7 = 16.1 pts per season

But, in a way, all drives originate from a kickoff. All drives' starting field position subsequent to a kickoff are biased by the kickoff result. For example, a poor kick that results in a starting field position at the 40 yd line will result in all subsequent drives being closer to the kicking team's end zone than otherwise, until another kickoff. For that reason, I think the real answer is a lot closer to 43.7 points per season than 16.1 points per season.

Additionally, an extra series on a drive means there are more plays that could result in a turnover. About 10% of all series result in either a fumble or interception. That further strengthens the effect of field position and the importance of deep kickoffs.

We began the analysis by comparing Rackers and Vanderjagt, who were extreme examples--about 4 standard deviations apart. If we repeat the above analysis by looking just a single standard deviation in kickoff distance (1.49 yds), the effect is 10.9 pts per season per SD.

My previous look at FG kicking estimated that every additional SD in accuracy resulted in 6.7 more pts per season. When compared to 10.9 pts per kickoff SD, it appears that kickoff performance is the more important aspect of place kicking. Interestingly, when Vanderjagt was cut in 2006 by the Cowboys, the news articles didn't bother to mention his short kickoffs, only that he didn't like to do it.

An Alternate Analysis of Field Position

Previous studies have examined the point value of various field positions. Perhaps the best has been David Romer's study regarding 4th down situations. To evaluate when coaches should "go for it" on 4th down, he evaluated the point value of a 1st and 10 from each position on the field. The figure below is from his study.


Between the 15 yard lines, the value change is linear--0.04 points per yard. A 6 yard difference, therefore, equates to 0.24 pts per drive. With an average of 182.6 drives per season, that's a difference of 43.8 pts per season--almost exactly the same result yielded by the "one additional first down" analysis.