Super Bowl Probabilities and Potential Match-Ups

Here are the probabilities of winning Super Bowl XLIII going into the conference championships. Pittsburgh is the most favored, followed by Baltimore and Arizona.

I've also listed the probabilities of the potential Super Bowl match-ups below.


TeamSB Champ
PIT0.45
BAL0.20
ARI0.20
PHI0.14


And here are the potential match-ups:


PwinGAMEPwin
0.39 ARI vs BAL0.61
0.32 ARI vs PIT 0.68
0.39 PHI vs BAL 0.61
0.32 PHI vs PIT 0.68

Conference Championship Predictions

This weekend AFC defensive powerhouses Baltimore and Pittsburgh match up, and NFC underdogs Philadelphia and Arizona square off.

The game probabilities are based on team performance for all games since week 9, with the exception of week 17 when some teams played at less than full strength. This includes playoff games to date.


PwinGAMEPwin
0.40 PHI at ARI 0.60
0.33 BAL at PIT 0.67


Probabilities based on the complete regular season would be:

BAL at PIT, 0.33 to 0.67
PHI at ARI, 0.67 to 0.33

Why is Arizona favored over Philadelphia when weeks 1-8 are thrown out? The Eagles racked up gaudy stats early in the season despite not having the wins to show for it. Eventually, their luck started to even out and they squeaked into the playoffs. But throwing out their best statistical weeks really hurts them. Plus, Arizona's last two wins against quality opponents were convincing, improving both their stats and their average opponent strength significantly.

Drive Results

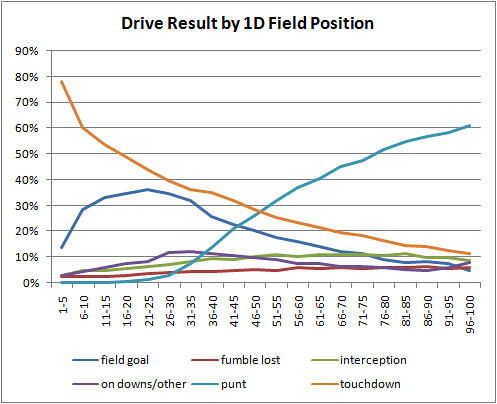
I had intended to post this a few weeks ago, but moved on to other things and forgot all about it. Continuing my data-dump series of posts of things that may only interest me, here are three graphs that illustrate the results of drives based on field position. Note that these are league-wide baselines, averaging all drives from the 2000 through 2007 seasons. Only drives that ended due to the expiration of time were excluded.


Each graph is based on first down field position. For example, for all 1st downs at a team’s own 35 yard line, offenses go on to score touchdowns 20% of the time. It doesn’t matter how the team got to the 35 yard line with a first down. They could have started the drive there or converted a first down from their own 20.

Field positions are defined as distance to the opponent’s end zone. A team’s own 20 is the “80 yard line.”

These graphs are part of my real-time win probability site. As the field position, down, and distance change during a game, my site continually updates the likelihood the offense will score either a touchdown or field goal.

The first graph depicts how often NFL drives result in scores.


The second graph depicts how often drives result in turnovers.


The third graph combines the two previous graphs and adds punts. It also groups the data into 5-yard increments so the lines are less noisy and easier to read.


Year of the Run Defense?

Before the playoffs started last year, I did a post on which facets of team strength are most decisive in the playoffs. I looked at passing offense and defense, running offense and defense, turnovers and penalties. For each game, I tabulated how often the team with the better season-long performance in each stat won the game. For example, in the playoffs, the team with the better season-long offensive interception rate won the game 58% of the time.

I also looked at playoff-caliber match-ups in the regular season. Playoff-caliber was defined as teams that would finish with 10 or more wins. I wanted to see if there was something special about "playoff football" beyond the fact that there are (usually) only good teams on the field.

The most intriguing result was the sudden importance of run defense. Teams with the better defensive run efficiency won regular season playoff-caliber games 48% of the time. But in the playoffs, teams with the better run defense won 67% of the time.

This year, the four remaining teams in the playoffs feature the #2, #4, and #5 best run defenses in the league. The team with the better defensive run efficiency has won every single playoff game but one so far this year. That's 7 for 8.

But I'm not sure this means anything. My analysis only used 5 years of data--55 playoff games. This year obviously supports the notion that run defense somehow takes on special importance in the playoffs. But 2007 showed the opposite. Only 2 of 9 games were won by the team with the superior run defense. Two more games were pushes.

Still, that's 64% overall for the 2002 through 2008 seasons. You'd expect a team stronger in any category to win more often, but 65% is the highest of all the core abilities including offensive passing, offensive running, defensive passing, and even turnovers. It's particularly remarkable because run defense seems relatively insignificant in the regular season.

I'm not sure what causes the effect. It could be just random variation and small sample size. But the effect might be real and it could be due to weather or even conservative gameplans. (We could call that the Schottenheimer Effect.)

"Pulling An Orlovsky"

With 7:39 left in the 4th quarter and a 3 point lead, the Baltimore Ravens faced a 3rd and 10 from their own 1 yard line. Rookie quarterback Joe Flacco dropped back to pass, then dropped back a little more. He very nearly stepped out of the back of the end zone for a safety, much like Lions QB Dan Orlovski did against the Vikings this year. In that game, the safety was the difference as the Vikings won 12-10. In the post-game press conference, Flacco even remarked that he almost "pulled a Dan Orlovsky." Flacco was only inches from doing the same thing. How costly would that have been?

At that point in the game, a safety would have reduced the Ravens' lead to a single point, making the score 10-9. Plus, it would have given the ball right back to the Titans, on average at the Tennessee 44 yard line. A Titans field goal now would have given them a late 4th quarter lead, instead of merely tying the game. According to my win probability model, the Titans would have a 0.56 probability of winning following a safety.

In reality, Baltimore was able to punt the ball, giving the Titans field position on the Ravens' 42 yard line. This gave the Titans a 0.39 win probability. The difference between the almost-safety and the actual punt is 0.17. That's a lot for a few inches and a single play. Although it wouldn't have been fatal, it would have swung the advantage to Tennessee.

Fumble of the Year

The play of the game had to be the forced fumble by Baltimore safety Jim Leonard on Titans tight end Alge Crumpler near the Ravens' goal line. Prior to the snap the Titans had a 0.55 WP, but after the fumble they had only a 0.25 WP--a swing of 0.30. In fact, it was a little higher because had Crumpler held onto the ball and been tackled, the Titans would have been sitting first and goal from about the 5.

Go for TD or Kick the FG?

Another interesting wrinkle in the game came with 4:39 remaining in the 4th quarter. Facing 4th and inches on the Ravens' 9, the Titans elected to kick the field goal instead of going for the first down. PFR beats me to the punch in analyzing this decision, but I'll add my contribution here.

My WP model is useful, but it's generic. It does not consider things like weather, or the particular flow of an individual game. For example, there are no adjustments for how well one team has been able to move the ball, or that one team has a particularly stout run defense. But those sorts of considerations need a baseline around which to operate, and my model can provide that.

With 4:39 remaining, a 3-point deficit, a successful conversion would have resulted in a a 1st and goal on the Ravens' 9, giving the Titans a 0.57 WP. A failed conversion attempt would have resulted in a 0.25 WP for the Titans. The conversion attempt would have been highly likely. "And 1" conversions are successful 70% of the time, so an "and inches" would be expected to be at least that successful. Because of the strength of the Ravens run defense, a conservative estimate might be 75%. The net WP of the decision to go for the 1st down is therefore:

(0.57 * 0.75) + (0.25 * 0.25) = 0.49

A field goal from the 10 is successful 92% of the time. Tying the score at that point gives the ball back to Baltimore at their own 27. This would result in 0.42 WP for the Titans. A miss leaves the ball and the lead with the Ravens, resulting in a 0.22 WP for Tennessee. The net WP for the decision to kick the FG is:

(0.42* 0.92) + (0.22 * 0.08) = 0.40

Going for the first down is the clearly better call. However, this is a league-average baseline. Other considerations can modify this result. But in my opinion, coaches and analysts tend to overestimate the importance of these considerations.

For example, up to that point of the game, Baltimore only scored on 2 of its 10 possessions. So you could say, had Tennessee failed to convert the first down, they could count on getting the ball back with the score still tied. Or this might indicate Tennessee would have a significant advantage in overtime.

But as a league average, offenses score on 1 out of every 3 drives. Was Baltimore's 2 out of 10 that much different than 3 out of 9? Not at all. In fact, they went on to score on their next possession (making it 3 out of 11) to win the game.

The Delay of Game That Wasn't

The biggest play in Baltimore's game-winning field goal drive was a Flacco 23-yard pass completion to TE Todd Heap. But the snap took place a second after the play clock hit zero, and the refs did not see it in time to call it. Did this make the difference in the game?

I think the right way to look at this is to look at the game situation prior to the pass. Had the delay of game been called, the pass to Heap would never have happened. Baltimore would have been facing a 3rd and 7 instead of a 3rd and 2. The chance of converting a first down drops from 60% to 40%. This would have dropped Baltimore from a 0.66 to a 0.62 WP. That's a pretty big jump, but hardly game-changing. The Ravens still would have had the upper hand.

Edit: The Safety/Goal Line 3-And-Out That Wasn't

I just saw this pop up over at Pro Football Talk. It appears that the Titans were actually stuffed for a safety on their drive that started at their own 1. Plus, they may have been erroneously given an extra down on the next drive. The extra down turned out to be the play that topped the highlight reel in which Ray Lewis knocked the helmet off of Ahmard Hall. It gave the Titans a first down and some breathing room on their drive that ultimately ended as a Ravens interception on the Baltimore 10.

Weekly Roundup

The two big topics in football stats this week were the BCS and the NFL overtime rules. I've already had my say on OT rules, so let's start with the BCS.

Baseball analyst Bill James made a minor splash with an article urging a boycott of the BCS system by quantitative analysts (Hat tip--PFR). His fourth point is very interesting and goes against conventional wisdom. The BCS is not the result of big conference and big school greed. James says that we would have a Division I playoff system now except for the fact that the large number of small and uncompetitive schools would vote to share the playoff revenue too broadly.

Maybe so, but there is an underlying problem with college football. It's an unstable system. In systems engineering terms, the best example of a stable system is a thermostat. If it gets too hot, the thermostat kicks in to make it cooler, and vice versa. The NFL is a stable system. A team with a top record is rewarded with lower draft picks and a tougher schedule. A team with too many top players will lose some in free agency. But in college, the effect is reversed. College football is like an anti-thermostat. Imagine a room in which the thermostat turns up the heat the hotter the room gets. College football works the same way.

A successful football program will get money, attention, television time. This will lead to better recruits and even more wins. In turn, there's even more money, big name coaches, and better recruits. And every top recruit on one team's roster is a recruit unavailable to competitors. That's why every year we see the same handful of schools competing for championships. Oooh, I can't wait to find out who the 2009 champion is going to be. Will it be USC, Florida, LSU, Texas, Oklahoma, or Ohio State? The suspense is killing me!

While James' point may be true, it's nearly impossible for most schools to become competitive. Maybe the only way to stabilize the system--to create some semblance of competitive balance--is to spread the wealth.

Also on the college front, the Numbers Guy points out that special teams success does not necessarily correlate with winning.

"ZEUS" thinks the Colts should have taken an intentional safety at the end of regulation in their losing effort at San Diego. ZUES is software built by a couple of PhD-types that aids sideline decision-making, such as when to kick or go the 1st down or when to decline a penalty. It's very similar to the win probability system here (except that they're trying to sell it to teams for over $100,000. Good luck with that. Psst Mr. coach, you can have mine for half the price.)

Reader Ed Anthony emailed me to suggest this Monday, but I dismissed the idea too quick. I was going to do up an analysis to prove that ZEUS was wrong. It seemed obvious to me. Taking the safety turns a SD field goal into a game-winning kick instead of a game-tying one. A safety would have made a FG slightly less probable because it would have given the Chargers worse field position, but not nearly enough to risk the loss instead of the tie. What I left out of the analysis is that it also makes a touchdown less probable. And even though a TD would have been fatal in either case, making the TD less probable makes taking the safety a slightly smarter move. It doesn't matter that the TD didn't occur, it would have been the better decision at the time. Good instincts, Ed!

Doug Drinen at PFR looks at whether specific types of match-ups disproportionately affect game outcomes. Suppose there are two equal teams overall, but there is one particular facet where one team is much stronger than the other. Is it decisive? It's a complex question.

A couple years ago, I looked at the same issue but in a different way. I added interaction variables to my game predition regression model. I used all the same efficiency variables I usually do, but added additional factors such as [offensive run efficiency * opponent defensive run efficiency]. I was testing whether any particular match-up of team qualities had a non-linear effect above and beyond just a linear additive effect.

To put it simply, teams just don't put their abilities up on a table and let them play out independently. Team strengths and weaknesses interact with those of their opponenets. I was testing those interactions to see if they were significant. Some were, but the effect was very slight. The model was no more accurate and was far more complex than my original, so I abandoned its use in 2006. Now that I have a lot more data, it might be worth a revisit.

JKL, also at PFR, looks at older QB performance in the latter part of the season. This is a response to what FO looked at last week. The PFR analysis is far more comprehensive and does find a late-season effect. Also check out JKL's clever idea on revamping overtime.

Sometimes, this weekly roundup post turns into a cross-link-fest with PFR, Sabermetric Research, and Smart Football (which features some great college analysis this week). So there's plenty of room for fresh blood. I haven't mentioned it in a while, but the Advanced NFL Stats Community site is up and going strong. There's a new post once every couple days, and the site gets a few hundred visits every day. All contributors are welcome, so if you have an idea you'd like to share, or even just an opinion on stats in the NFL, please join in. There is data available for anyone who wants to kick it around.

Dennis O'Regan has two posts, one on how Baltimore's defense travels (I'm guessing it travels just fine!) and another on starter vs. backup QBs. Derek Singer looks at what kind of teams win championships. Josh Fryman has some observations on how regular season records may not be predictive of playoff success. Bob Burns wonders how a prediction system that doesn't account for wins can actually predict winners. Doug and Patrick Walters share their technical-financial-based system for predicting team fortunes.

Lots of activity this week. Enjoy the best NFL weekend of the year, and don't forget to check out the Win Probability site during the games. There's a special offer--this weekend only--get $100,000 off your first 5 visits!

Bad Overtime Logic and Good Kickers

One thing about the web is that you can tell what topics fans are genuinely interested in. This week there were many hits on the OT coin flip from people searching Google on the subject, and my article on the topic from September was bounced around fan message boards all over the country.

What Is Fair?

In my original article I point to the fact that in about 1 in 3 OT games, the coin flip winner scores before their opponent has a chance to go on offense. In total the coin flip winner wins 60% of all overtimes. At FO this week, they wrote “…only 60%...” as if that’s just a small edge.

I couldn’t disagree more. You could think, "50% is the optimally fair rate, and 60 is only 10 'more percent' than 50. Hey, 10% isn’t very much, so the coin flip is close enough to being fair. What’s the big deal?" But this is a flawed way of looking at it. Percent and percentage points are not the same thing.

Would you say that 3:2 odds represents a significant advantage? I sure would. That means that one team’s chances of winning are half again larger than the other’s. Well, that’s exactly what a 60% win-rate is—a 60/40 or 3:2 advantage. That can’t be ignored.

If you still don’t feel that a 3:2 advantage is unacceptable, what would be the odds at which you would say something needs to be fixed? 2:1? That would be a 67/33 split…and we’re “only 7%” away from that.

"They Had a Chance to Make a Stop"

One argument I frequently hear in defense of the status quo is "the defense had a chance to make a stop." True, even though one out of three OT games ends without one team ever touching the ball, the losing defense did have an opportunity to force a punt or turnover. On average they have a 2 in 3 chance of stopping the coin flip-winner from scoring. The problem with this argument is that the coin flip-winning defense would have a 100% chance of making a stop. The opposing offense will never take the field.

Even if the defense does manage to stop the coin flip-winning team from scoring, the advantage persists and cascades throughout the OT period. However the flow of the game shakes out, the best the coin flip-loser can do is break even in terms of possessions, and the worst the coin flip-winner can do is break even. In other words, if both teams are stopped from scoring on their first drives, the problem starts all over again.

Field Goals

Another point I made in my article was that a big part of the reason for the advantage was the movement of the kickoff spot from the 35 back to the 30 yard line. This had the unintended consequence of increasing the advantage of the receiving team in OT. Touchbacks became far less common and starting field position improved for offenses. But this is only part of the story.

The reason the NFL moved the kick off line back was because kickers had improved so much over the years, both in distance and accuracy. In 1974, the league FG% was 60.6%. This year, it was 84.5%. And that even masks how much kickers have truly improved. In 1974, 36% of all FG attempts were from 40 yards or beyond. In 2008, the figure was 41%.

These days, teams aren’t looking to get inside the 25 for a field goal attempt, they’re just hoping to get inside the 40. Getting a quick score in overtime has become a far easier proposition.

Field goals have gradually warped NFL football. In 1974, there were 3.0 FG attempts each game compared to 3.9 in 2008, a 30% increase. Kickers have become so accurate and kick such long distances that the sport has changed before our eyes. Overtime might be where the effect is magnified and most apparent, but the entire game is different.

Is it time to narrow the field goal posts?

Super Bowl Probabilities

Carolina is still the slight favorite, mostly thanks to their easier task this weekend. On the AFC side, Pittsburgh has the edge. Arizona fans, don't hold your breath...but that's exactly what I would have told Giants fans last year.


% Probability


TeamConf ChampSB Champ
CAR4525
PIT3921
NYG3417
TEN3214
PHI168
BAL167
SD135
ARI52


One thing that hits me when I look at this table is that the "best" team probably won't win the Super Bowl. You might not agree the best team is Carolina. That's fine. I'm not sure if they are or not. It might be Pittsburgh or the Giants or any of the other remaining teams. But whoever they are, they're probably not going to be the champs.

This isn't a new revelation to me at all, but it's particularly clear now perhaps because there isn't a definitive favorite this season. The task of winning 3 or 4 playoff/Super Bowl games, even for a dominant team is so improbable that no one team would realistically have a greater than 50% chance. A team would need an average 80% chance of winning each of three games against playoff caliber opponents to just have a 50/50 shot at taking home the Lombardi Trophy. (0.803 = 0.51).