Win Probability Forfeited 2012

by Matt Meiselman

Matt has been helping me crunch some 4th down numbers this off-season. He is a senior at the University of Maryland studying broadcast journalism. He's originally from New Jersey, but loves New York sports. Matt aspires to work in sports media and has a passion for sports statistics. -BB


Fourth down decision making is one of the most controversial aspects of coaching in the NFL. Act too aggressively and miss? You get blamed for a loss. Act too timid? The fans will be calling for your head. Most NFL coaches are operating with the mindset that whatever puts their team (and their job) at the least amount of risk is the right choice to make. This has been, and will always be, the wrong way to try to win a football game.

In last year's article on this subject, Brian talked about how coaches aren’t just saving wins if they’re more aggressive; they are simultaneously forfeiting wins by being too meek. In 2011, the average team forfeited .65 wins for the year on 4th down decisions alone. The NFL has started to become more risk-friendly instead of risk-averse, and you’d expect that with more innovative minds in the game, like Bill Belicheck and Jim Harbaugh, the league would be trending towards more optimum game management. This was not the case in 2012.

During the 2012 season, the average team forfeited .73 wins, a significant increase from the year before. The average win probability forfeited per opportunity also rose, jumping from 1.6% of a win to 1.9% of a win. Below are the calculations for each team:

Team Analytics Interns

Want a chance to work for an NFL team?

An NFL team is looking for football research interns for the summer. There is a chance that the position could become full time after the summer if the candidate is outstanding.

All interested candidates should send a resume and cover letter to nflanalyticsintern@gmail.com. In the cover letter, please detail any relevant analytics experience and describe one question you would like to study if you had access to an NFL team’s data. Special preference will be given to those with database and/or programming skills.

Tell 'em ANS sent you.

What is Ed Reed's Going Value?

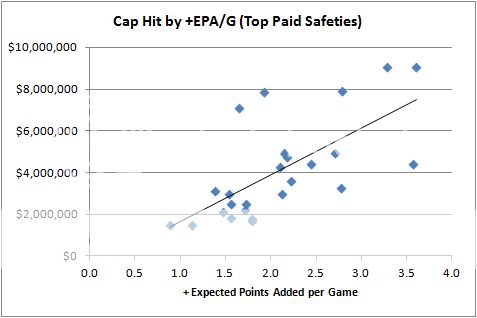
Last year I looked at the salaries of free agent safeties to estimate the going rate based on production stats.  FA safety salary correlated fairly well with production, specifically +EPA (positive Expected Points Added). With Ed Reed, one of my favorite safeties, on the FA market at moment, I thought I'd take a look at what would be a fair market price for his services in 2013.

Here, price is defined by salary cap hit. NFL salaries are notoriously complex with bonuses and guarantees. But these are boiled down into a single cap number, which is the cost to his team's overall salary cap, the most precious resource it has in acquiring and keeping players.

The analysis here produced the chart below. In short, top FA safeties are valued at about $2.0 million for every +EPA per game, minus $170k.


For example, for a guy who produces 2.1 EPA/G, his going rate would be about $4M per year. So where would Ed Reed stand in this context?

Reed is a future Hall of Famer, but he is now 34 and headed into his twelfth season. Here is how his total production and per-game production have tracked over the course of his career. (Note that all stats  are for regular seasons only. +EPA stats can be found here.)

New NFL.com Stat Viz

The NFL’s website is getting on the data visualization bandwagon. They recently unveiled a project called ‘StatLab’ which involves two types of plots.

The first one isn’t terribly interesting. It just illustrates each division in terms of W-L record. The more wins, the bigger each team’s circle. This is a textbook lesson is when a table is better than a chart, but it’s a start. How about spicing it up with a dynamic chart that recreates the horserace of the season? Teams grow and shrink as the weeks click by. Or year-to-year improvement/decline in season records?

The other set of charts is more interesting and interactive. There are ‘radar’ charts for player statistics. Each stat is depicted as a ‘dimension’ or distance from the center of a plot. The better the stat, the further out the point. The points for each stat are connected and filled, so the bigger the shape, the better the performance. You can select a number of players to compare. The average stats are depicted for the selected position too. (Don’t show this to Joe Flacco’s agent. It’s amazing how close Flacco’s numbers hew to average in nearly every category. The one exception is interception total.)

Sloan Sports Analytics Conference Update

Sloan is coming up this Friday and Saturday. I'll be part of panel consisting of Jack Del Rio, Herm Edwards, and Thomas Dmitroff. The title of the panel is Monday Morning Quarterback: Coaching and In-Game Decisions. The format will primarily involve looking at a variety of interesting situations from actual games. Tony Reali from ESPN will be the moderator, and it goes without saying that it should be fun. It's on Saturday afternoon, and is the keynote feature event of the entire conference. ...Ok, I made that last part up...It's actually on Saturday morning. If you won't be there, the panel will be featured via webcast.

If you're going to be at Sloan, please come say hi. (Please note that I'm not the former GM of the Toronto Maple Leafs.) Don't let my unapproachable scowl fool you. It's my first time there, and I'm looking forward to meeting as many like-minded analytics fans as I can.

Joe Flacco's Playoff Run Was Truly Elite (And Colin Kaepernick Was Pretty Good Too)

In January of 1990 -- the 1989 playoffs -- Joe Montana rattled off three straight incredible games. The 49ers legend compiled 800 yards on 65-of-83 passing (78 percent), fired 11 touchdowns and didn't throw a single interception. His five touchdowns and 297 yards paced San Francisco to a 55-10 demolition of John Elway's Denver Broncos in Super Bowl XXIV. The performance capped what remains the best postseason ever from a quarterback.

Joe Flacco's January and February of 2013 didn't eclipse Montana's accomplishments, but he arguably came as close as anybody in the 23 years since, and almost certainly closer than any other Super Bowl winner. Flacco did it in one extra game and 43 extra pass attempts, but he matched Montana's playoff record 11 touchdowns (also shared with Kurt Warner in the 2008 season) and zero interceptions. His 1,140 yards rank third all-time, just behind Warner and Eli Manning in last year's playoffs.

We only have WPA and EPA data dating back to the 2000 season, but Flacco's playoff run ranks second in both to Warner, and tops of any Super Bowl winner:

Some notable performances are highlighted; mousing over a dot will reveal the quarterback's identity.

More SB 47 Analysis

I was just getting started with a more full analysis of the SB game decisions. I wanted to take a detailed look at BAL's two FG decisions and SF's decision not to go for 2 when down 28-13 (28-12 prior to the XP). Just when I finished doing the calculations for BAL's 4th and 2 from the SF 20 and their 4th and goal from the SF 1, I got an email from intrepid reader-correspondent Matt Meiselman.

Matt kindly sent his own analysis, using the 4th down and win probability calculators. This is exactly what those calculators are for...so I don't have to do all the work! Take it away, Matt:

In a Super Bowl with colossal storylines, including the impending retirement of Ray Lewis and a 34-minute blackout delay, the battle of the Harbaughs was arguably the biggest. Both coaches are considered among the league’s elite, and there won’t be much criticism of either of them following such a well-played season by both the Ravens and 49ers. In the Super Bowl, however, there were a few decisions made by the Harbaugh brothers on 4th down that significantly decreased their respective teams’ chances of winning.

Slate/Deadspin: The Little Things that Cost the 49ers

My analysis for SB47 is up over at Deadspin and Slate. I took a look at some of the more interesting decisions from the game--the fake FG, the intentional safety, and a couple 4th downs. But the biggest decisions in the game turned out to be the littlest ones. If there were ever a case study in the importance of saving your 2nd half timeouts, this game should be it.