
 In a recent post about team balance, I noted that we should expect a correlation between a team's offensive performance and its defensive performance--at least, not in the same way we would expect to see a team's passing and running performance correlate. Jared commented that although we shouldn't expect a positive correlation, perhaps we should expect a negative one.
A negative correlation between team offense and defense would mean that the better the offense, the worse the defense, and vice-versa. This would make sense in the salary cap era because the more resources a team invests on one side of the ball, the fewer resources it can invest on the other side. If you are throwing $15 million/yr at a star QB, that's $15 million less available to shore up a weak secondary. And that star left tackle drafted in the first round is a top defensive end that's going to some other team.
On the other hand, it could be that good GMs and well-run organizations would simultaneously produce teams composed of both above-average offenses and defenses. Conversely, dysfunctional organizations would produce poor squads on both sides of the ball.
It turns out that Jared was right, at least in terms of Success Rate (SR). I looked at team performance on offense and defense for all teams in the 2000 through 2009 regular seasons. In terms of SR, there was a negative correlation to the tune of -0.20.

But something strange happens when we look at things in terms of Expected Points Added (EPA). The correlation is positive, this time to the tune of 0.06, which is only marginally statistically significant for 318 cases (team-seasons).

Now look at the relationship in terms of Win Probability Added (WPA). The correlation is still positive but now significant at 0.17.
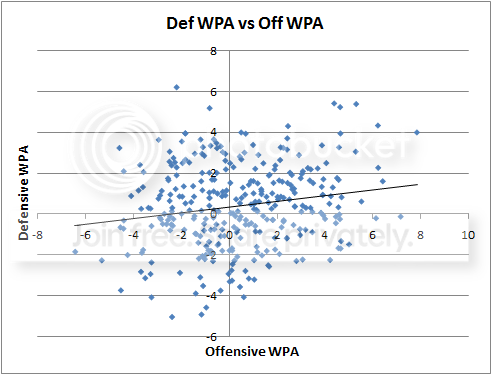
This is puzzling. It appears that the more that context is considered, the more a team's offensive and defensive performance correlate. And the less that context is considered, the more negative the relationship becomes. EPA and WPA are both much more sensitive to relatively random events, such as broken plays and turnovers, and are consequently subject to large swings.
Here's one half-baked theory. Say there is a team with a good offense and a mediocre defense in terms of SR. The good offense puts pressure on opposing offenses to respond to scoring, which allows its defense to convert a mediocre SR into better EPA, and then even better WPA. The same relationship would hold for teams with good defenses and lesser offenses. But that's just one theory, and there are bound to be better ones.
I like it when at first things make no sense. It usually means we're probably about to learn something cool.


another half baked theory: if a coach knows its defense is on the weaker side in terms of brute force SR, maybe they start gambling more to compensate? Maybe they jump routes which occasionally results in more turnovers? Could we look at the teams which exhibit weaker SR numbers but better WPA and see what their DefInt% and DefFF% numbers are?
Maybe good teams don't win via a good offensive success rate. Maybe they win by having fewer successes, but having their successes be HUGE successes.
WPA considers time used up on the clock, right? Maybe it's the only metric that correctly notes that taking a knee is a good play, or allowing the opposition to run up the field is OK if they're way behind and it takes a lot of time off the clock.
I would have predicted a negative correlation in SR -- if the offense is good, the defense is free to give up yards, as you say; and if the offense is terrible, then the defense might have to gamble to make stops (and vice versa on both counts).
A WPA correlation just says that good teams are good, right? Time of possession might be one way to achieve that correlation without any direct relationship. Did you ever check whether SR correlates with WPA?
This weekend when i was watching the games I noticed that sometimes teams that are behind play in order to slowly and methodically march down the field. They stop going for home runs, the run a lot on first down (as if to say you cant make me change my game plan!). It reminded me of the article that you (Brian) wrote "Are coaches too timid", which shows that favorites increase the variance of points scored while the underdogs actually decrease their variance. I was thinking this could be an explanation for the success rate; loosing teams don't want to be embarrassed so they stick with high success rate plays, short passes and runs (which the offense will gladly give up); all the while those plays are actually costing them in terms of WPA.
Have you considered that all of these could be zero correlation within error? Telling just-so stories about the noise in your data is not good statistics.
Last comment was me (if anybody cares), not an anonymous criticism. Just clicked the wrong thing.
He qualifies some of the correlations in terms of statistical significance. Assuming a p value of .05 (the most liberal definition of statistical significance in many cases), the correlations would be due simply to chance only 1 in 20 times. Stated another way, 19 out of 20 times, they are not within error.
Correlations can be very weak, but still statistically significant...it just usually takes a larger sample size.
Other thing to remember, statistically significant does not imply meaningful.
Could you look at a breakdown of offensive SR, EPA, and WPA depending on game situation (score margin and time remaining)? For instance, I'd expect teams that are losing by more than a touchdown in the 4th quarter to have a high offensive SR, since the defense will be playing safe to avoid giving up the big play. But their EPA and WPA might not be any higher than normal - they might even be lower, since the offense will take chances and risk turnovers to attempt high variance plays.
That could produce a negative correlation between a team's offensive SR and defensive SR, since teams with bad defenses will get more chances to pad their offensive SR in garbage time and teams with good offenses will hurt their defensive SR in garbage time. But you wouldn't get the same negative correlation for EPA and WPA.
How about if you have a dominating defense that forces an incredible amount of turnovers, particularly in the opponent's territory, it will increase the offenses chances of scoring.
My theory: many many factors create positive and many many factors create negative correlations between a teams offense and defense. The surprising result (to me) is that they very nearly cancel each other out.
Re: Statistical Significance...
http://www.nytimes.com/2011/01/11/science/11esp.html?_r=2
http://wmbriggs.com/blog/?p=2730
@BIGKIDD325
WPA, EPA and SR all account for field position.
Good follow up.
Did you adjust def EPA/WPA so that more is better? Since good numbers are low, or large negative, it would make sense that the correlation would have the opposite sign since higher is better for Def SR.
i'd second mark m's comment above.
first, even if you focus on the largest of these correlations, SR's -.20, you're saying that offensive SR and defensive SR share 4% of their variance (i.e., -.20^2). in other words, 96% of offensive SR has nothing to do with defensive SR, and vice versa. if there's anything cool found out about that 4%, great. i'd be much more interested in the other 96%.
second, and more generally, the formula for a correlation coefficient has sample size in the denominator, so correlations are by definition highly sensitive to sample size. to me, that .06 correlation for EPA is only even marginally statistically significant because n = 318. increase the sample size to 600, and watch how it magically becomes full statistically significant. lower the sample size to 100, and watch how it magically loses its marginal statistical significance. add to this that .06^2 = .0036, meaning 99.64% of offensive EPA has nothing to do with defensive EPA (and vice versa), the only real practical conclusion here is to totally ignore that correlation altogether.
i'll acknowledge that it's difficult to find larger correlations in NFL stat analysis, but correlations in the vicinity of .1 and .2 are woefully low even by that standard.
p.s. i ran the correlation between offensive DVOA and defensive DVOA, and it's -.048 (2002-2008; n = 224). given that DVOA's just a gussied up version of SR that uses yards instead of WPA as its measure of "success," i find it interesting that the SR correlation you found is almost 4 times larger. there's a clear methodological implication of that, i think, which i'd discuss here if you wanted to go down that road.
4% shared variance is only true in the purest, strictest sense. There is another 16% shared by the effects of the two variables interacting with other variables.
I think an r of -0.20 is quite remarkable considering that the offense and defense of team are never on the field at the same time. Random variation is going to be a very large part of the overall R in a 16-game season, so that -0.20 is a fair share of everything else that isn't random.
The fact that the r for EPA is near zero is part of the point of the piece. As you add situational factors to the mix, the r goes from significantly negative, through zero, to significantly positive.
Regarding DVOA, from what I understand, it's a SR metric with bonuses for big plays, plus it over-weights red zone plays and discounts 'trash time.' In a sense it's a kluge of all three concepts: SR, EPA (big play bonuses), and WPA (game situation). I'd expect its correlation between off and def to fall somewhere between SR and EPA.
Here's one question I have. Does the DVOA of team rushing correlate with team passing? For offense or for defense?
As to statistical significance tests, the great (and unique) economist Deirdre McCloskey warns not to become slaves to them. Countless findings that rigorously pass 95% significance are bunkum (New Scientist: "Most scientific papers are probably wrong"), while if one has good reason to believe something previously unsuspected is true, and a test supports the idea but at only 65%, that can have serious real-world meaning. Not to digress from football stats. Just saying, for context. Statistical findings should aid judgment, not replace it.
About the significance value and those articles posted by Adam H (very interesting);
statistical significance is what it is, just dont make it out to be more than it claims to be. p = .05 just means that 95% of random data sets will not be as extreme as this data set. Sometimes that has meaning, sometimes it doesn't.
Also about the large sample size increasing the statistical significance, the formula isn't broken! its because the more samples you have that continue to show the same correlation the less likely it is due to chance. You can't just add 300 to the significance calc without having 300 more data points! and those 300 data points can easily be random and heavily decrease the correlation if there is no real trend. My point is the formula is right, there is a reason that sample size is in there.
"Did you adjust def EPA/WPA so that more is better? Since good numbers are low, or large negative, it would make sense that the correlation would have the opposite sign since higher is better for Def SR."
You made it nice and easy to copy and paste the data so I ran it and the correlations all go in the same direction because of what I mentioned above. It's probably easier to explain using regression than correlation.
Regressing OWPA on DWPA gives a coefficient of 0.21 (note: t-value is 3.06 so it's quite significant). DWPA is opponents' WPA against your D so 0.21 means that your offense getting 1 more WPA will cause your D to give up 0.21 WPA more (as usual, all else equal). Increasing offensive output 10 WPA wins will lead to your defense giving up 2 more WPA wins.
Regressing OSR on DSR gives a coefficient of -0.25. Note that DSR is one minus opponent success rate against your D. The -0.25 means that, all else equal, increasing your offense's success rate four percentage points will cost your D one percentage point in success rate. In other words, your opponents will be successful against you one more time out of 100 plays for every four more times you are successful against them.
I'm not sure how clear that was, but in both cases teams with better offensive stats tend to have worse defensive stats and vice versa.
Well, when you put it in the context of being surprised that there'd be a correlation at all, i suppose we can attribute some meaning to that -.20. I'd agree that there's really no obvious reason why'd there be even that large of a correlation between offensive SR and defensive SR. so, in that context, -.20 is a decent whodunit to solve. my comment was more of an absolute one, considering .2 to be really small in comparison to stuff that really matters (e.g., your correlation between SR and winning, or the R^2's that are found in game prediction models). believe me, i think the same thing when i see FO writing up pieces representing .2 correlations as meaningful.
as to your question, same data set (2002-2008, n = 224) shows correlation between pass offense DVOA and run offense DVOA is .542. correlation between pass defense DVOA and run defense DVOA is .477. looking back at the SR-analogous correlation you found (r = .41 for both offense and defense), these are just a tad higher. of course, i think in that original SR piece of yours, you didn't use opponent adjustments, so the correlations are probably higher for opponent-adjusted SR, to the point where they're as high as the ones for DVOA, which of course is opponent-adjusted.
Andy-
i wasn't impugning the character of the formula for a sample correlation. of course sample size is in there for a reason. i was just making a methodological point that you're more likely to find statistical significance as sample size increases simply because of the mathematics involved; not because there's anything meaningful about the correlation in a practical sense. or, as mark m. put it above , "statistically significant does not imply meaningful."
i apologize if anyone, especially the correlation formula, was offended by my remark.
Danny-Cool. Thanks. That's higher than I would have expected.
Brian - In regards to your tweet about coaching becoming more agreesive they talk about the falcons adding about 30 points and possibly 3 wins. Do you agree with those numbers? It seems a little high but I haven't analyzed the 2010 PBP data yet. If so it could help explain part of their outlier season in regards to their efficiency stats.
Buzz-Definitely possible. Let me run some numbers. Good catch!
Using the same situations cited in the article (inside the 50, 4th and 1, 2 or 3, and outside 4 min to play), the stats are correct. 18 opportunities, 13 conversion attempts, and 11 successes.
The successes (ignoring the failures) were worth a total of 0.90 WPA (0.9 wins). Including failures, their 4th down attempts were worth 0.7 WPA.
But interestingly enough, the attempts net 29.2 EPA, close to the 30 points claimed in the article!
By far, the biggest play was a conversion against GB in the regular season, worth 0.20 WPA.
However, this does not set them apart from the rest of the league in terms of winning games. Many teams do go for it in opponent territory on 4th and short, especially in no-man's-land. The average NFL team nets 0.72 WPA and 7.4 EPA in similar situations.
So two things: 1) Good for ATL!, but 2)It doesn't explain their good fortune. I'll probably make a full post on this.
" It appears that the more that context is considered, the more a team's offensive and defensive performance correlate. "
Could contex be coaching? Would it be possible tor replot the data with teams (head coaches) identified? Maybe a subset of the data is driving the result.
I think it's more difficult to score against a defense when the same team's offense is good than when the offense is bad : not on one particular drive of course, but over the course of many drives. Just because good offense create lesser field position.
The strenght of the defense remains the same so, as expected and because of salary cap limitation, SR correlation is negative.
WPA correlation is however positive because it is harder to had lots of WP when the opposing offense scores tons of point and when you start every drive deep in your territory
What if the study were limited to the first 3 quarters - before prevent defense strategies kick in?
beprepn
Have you run defense correlations against run offense and pass offense separately? It seems to me that a good run game helps a defense, but a good pass game doesn't necessarily.
How to calculate the # of offensive & defensive plays per game?