

Trash-time distorts the relationship between true team strength and team statistics, be they conventional or advanced, total stats or per play. To determine true team strength, we need to weed out the random outcomes and discount trash-time performance.
WPA is probably the ultimate explanatory statistic. EPA is less explanatory and more predictive, because it's not subject to the leverage of time and score, but it's also subject to the random outcomes of a bouncing or tipped oblong ellipsoid.
One way to eliminate trash time from the data would be to simply throw out the fourth quarter. As it turns out, there is a lot of baby in that bathwater. A better way might be to throw out data based on Win Probability (WP). A statistic that's based on EPA, but limited to when the game is still in play, could be the answer.
There's still the problem of the bouncing ball. There are sometimes huge EPA plays--James Harrison's 99-yard TD return in the Super Bowl a couple years ago comes to mind. A play like that represents almost a 12-point swing in EP, but it's the kind of event that's so rare that it makes little sense to project future team performance on such a distorting play. Put simply, it does not have the equivalent predictive value of two solid 80-yard offensive drives.
But it's representative of something. We don't want to throw plays like that out. What we can do is limit their statistical impact. We can cap their EPA value at a certain amount, so that no single play will have more or less than a chosen value.
To start, I chose to limit the data to plays in which the offense had between a 0.05 and 0.95 WP. That eliminates situations when a team is significantly ahead or behind, and may be playing in a way that distorts 'normal' football.
Then I capped the EPA values for all plays to 2.0 points (and -2.0 points). This limits the impacts of freak plays--blown coverages, pick sixes, or very long runs. Football is bounded by end zones, so a run that breaks past all defenders from the 50 yd-line would have a higher EPA value than the same run that occurs from the opponent's 20-yd line. The fact that it happened from midfield rather than from the 20 is not an indication of additional team strength.
Both of these limitations are arbitrary, and are open to revision. For now they represent my own intuitive sense of things. An turnover is typically worth about 4 EPA, so the cap throws away about half the impact of a turnover.
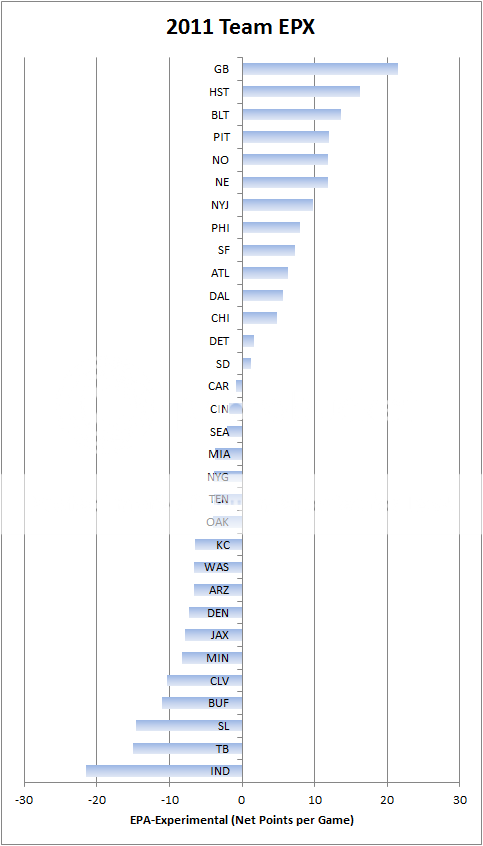
In summary, I've created a new team stat I'll call EPX: Expected Points-Experimental. It starts with EPA. Then it throws out trash time, ignoring it completely. Lastly, it caps EPA values for any single play at 2 points, limiting the statistical impact of very large plays.
The chart below ranks teams in terms of EPX through week 13 of the 2011 season. It included both offense and defense. To generate the final results, I computed EPX per play, then multiplied that number by the average number of plays per game (about 108). The result is in terms of net point difference per game. GB's defense comes out as 21st in the league.
EPX isn't intended to replace any other stat here at ANS. It's just another perspective on the numbers surrounding team strength. EPX does correlate better than GWP at the moment with the team rankings derived from point spreads (as computed by Michael Beuoy), 0.80 vs 0.77.
Future improvements would include tweaking the arbitrary limits of 0.05 to 0.95 WP and 2.0 EPA, as well as applying opponent adjustments.


Instead of arbitrarily eliminating information that occurs when WP is outside the range (0.05, 0.95), if you have data in the form of (WPA, EPA) for every play, would it be possible to estimate (model) the anticipated EPA when WPA=0.5. For example, some sort of regression model where WPA is the explanatory variable(x) and EPA is the response variable (y), then find E(y|x=0.5). You could still cap y at +/- 2 if you wanted, but it'd be interesting just to see a scatterplot if nothing else.
So basically, you frigged the data to try to get the Packers the ranking your gut felt they should have and you still came up short... what are you, FO? :)
I agree with the other Brian that posted above - a regression to model various stats at WP=0.5 is probably the ideal solution here. I can see the premise of the argument, that you call plays differently when you're up big, but I don't think throwing them out arbitrarily is the right solution because they do still tell you something.
Mind, I'm guessing a regression to predict at WP = 0.5 is almost an extrapolation for the Packers. The vast majority of their plays must be above 0.5 WP.
Ah, a Bayesian/Regression debate!
Anyhow, I prefer the results of this to your standard rankings. Both share the top spots, though in somewhat different order.
More interesting are what happens to the Giants and San Francisco. The Giants move down a lot. San Francisco moves up.
I like that. I don't understand your standard rankings, which highly ranks the Giants - a team that has given up more points than it has scored. And I never understood why your standard rankings value San Francisco so low. Where they sit in these rankings makes more sense to me.
It would be interesting to run last year's data through this model and see if it predicted playoff teams better than the standard model.
Also, your standard rankings put Houston ahead of Green Bay. Absolutely no one believes that. Here, Green Bay is way ahead of the pack (no pun intended).
No one is trying to build a DVOA kluge here. If we wanted to do that we'd over-weight clutch/red zone plays.
What prompted me to do this was how GB's defense shows up as purely average on the EPA graph, but is near the bottom in GWP.
SF and NYG are curious cases. It's worth looking into what causes the discrepancy. GWP gives a ton of weight to offensive pass efficiency, and SF is below average while NYG is well above average in that category.
I was only messing about the FO thing. I'm you and I both are cynical about 'statistics' that feature arbitrary cutoffs and adjustments.
I'm actually curious as to whether you've found any link between game situation (as measured by WP) and EPA. I had a brief look before at passing yards per attempt and point difference and found little if any correlation. I wonder if 'garbage time' is as much of a myth as clutch.
That's an interesting question--how much and in what way does performance really change in trash time. The one thing we do know, from simple observation as well as from Carson's analysis a few weeks ago, is that run/pass ratios drastically change.
Incorporating time into play by play based is one of two areas I think are not well understood, at least by me.
What is garbage time?
When does time become a factor?
How does garbage time change if Brady, or Tebow or Palco is playing? Or is that just being "clutch" and not real?
I like how you derived your garbage time definition. Certainly more effort into a smooth function rather than a zero/ one change at 95% would make it more elegant. It's not clear it would be an improvement.
The second area I don't understand is: why in a strictly statistical treatment ( no momentum) does a turnover matter more than any other change of possession. Possession alternates. A twenty yard interception on third down should be the same as a 45 yard punt with a 25 yard return
Wanted to throw an idea out for consideration. I keep running into a phenomenon in all sports where using medians cleans out some pollution and paints a clear picture. Is it possible that something simple like "median play on offense and defense when the scoreboard is +8 to -8 (one score)" could provide a decent starting point?
Second question, does anyone have an easy way to compile that data (lol)? I've done a few games over the years by hand...but that stops being fun fairly quickly...
"It would be interesting to run last year's data through this model and see if it predicted playoff teams better than the standard model.
This would mean absolutely nothing.
Sf has one of thes best special teams units. They have the best net starting field position, and opponents have the worst. Without accounted for that, the niners are just an above average team.
Interesting concept. This feels like a first cut; I think you can refine this approach quite a lot. A couple things that occur to me:
1) Rather than throw out ALL trash time, which requires a somewhat arbitrary decision of when a game passes into "trash", simply scale every play by the lower of the two teams WPs at the time. So, if a player makes a play that is worth .5 EP at a time when one team has a 60% chance of winning and the other team has a 40% chance of winning, that play gets (.5 EP)*(40%) = .2 EPX. For big plays that really change WP, take the higher of the two endpoints - so a play that takes a team's WP from 10% to 30% would get scaled by .3, while a play that takes a team's WP from 80% to 95% would get scaled by .2 (i.e. 1 - 80%).
If the goal is maximizing predictive power, then I suspect that a hard cutoff from 100% weight to 0% weight is optimal. What I'm suggesting here - essentially a linear weight from 100% at a 50/50 game to 1% at a 99%/1% game - is probably overdoing it the other way. My suspicion is that the optimal EP weights based on game situation would give full weight to everything from about 25% to 75%, and would then have a gentle, logistic/sigmoidal dropoff toward zero at the edges.
2) Rather than capping EP at 2 (which, again, seems a bit arbitrary), develop a model to figure out the predictive power of various high-EP plays, and discount them based on their (lack of) predictive power. If players who throw 80 yard TDs tend to throw lots of 80 yard TDs, then the EP for those plays shouldn't be discounted very much, because they actually have predictive power. On the other hand, 12 EP fumble returns are almost surely not predictive of future 12 EP fumble returns, so it should probably get cut down quite a bit.
This is my least favorite stat on ANFLS. Maybe it's because I get to see in more detail what's going in the meat grinder. I value the stats on this site because they are intuitive (focus on units) and seem less arbitrary (I'll tweak these weights...) than others.
My biggest issue with EPX is the arbitrary cutoff of EPA at 2. I also don't understand the need for a new EP stat. I use EPA primarily to compare individual players' impacts on a game or season. I rarely look at team-level EPA.
Brian, you give us a whole post about Green Bay's defense, and then show us the stats for the whole team! Where's the offensive and defensive breakdown? If you hadn't said GB's D ranked 21 I would have thought they were 1st in EPX.
Oops...
"If the goal is maximizing predictive power, then I suspect that a hard cutoff from 100% weight to 0% weight is optimal."
I meant NOT optimal. Kind of a major typo there.