

As a refresher, EP is a concept of football utility. It measures the net point potential at any state of a drive, based on down, distance, and yard line. For example, a 1st and 10 at midfield represents 2 EP to the offense, meaning from that point forward it can expect, on average, a 2-point net advantage over its opponent. More details on the concept can be found here.
With offense gaining an ever firmer upper hand, the EP curve must be affected. But it can’t just be sliding up across all states. At its end-points, the curve must be bounded at slightly under 7 points at the opponent’s goal line to slightly less than -3 points inside a team’s own goal line. We would therefore expect the curve to bow slightly upward over time.
The graph below plots raw, unsmoothed EP values for 1st and 10 (or goal) states in normal football situations, when time is not yet a factor and the score is reasonably close. The blue line represents the first three seasons in my data set, 2000-03, and the red line represents the most recent three seasons, 2008-11.
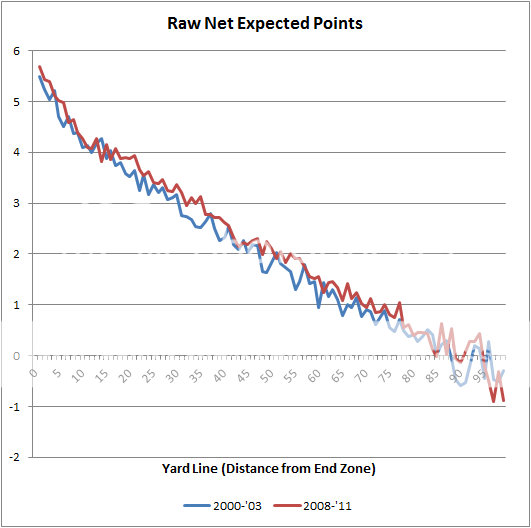
The curves for the two periods are not drastically different, but there is a subtle increase over time. Interestingly, the difference inside the opponent’s 20 is smaller than elsewhere on the field. There is also a more sizable increase in the longer field goal ranges, which reflects the increased long distance accuracy of kickers.
The difference between the two periods is not as large as one might have expected. One reason is that football is iterative. Even as an offense is more likely to score on the current possession, so too is their opponent more likely to score on the subsequent possession. This mitigates the effect of offensive potency on the EP curve, but not completely.
This trend on the EP curve pales in comparison to the team-unique curves. Note the dramatic difference between 2011’s top and bottom teams, the Packers and Rams.

The Packers’ EP curve is much higher throughout the field. That’s expected. What’s more interesting is that it’s flatter. Notice the slopes. The flatter the curve the less important field position is. Take an absurd example to illustrate the point. Imagine a football world with a perfectly horizontal EP curve. It wouldn't matter where on the field an offense got the ball because it would always score the same amount of points. In this world, punts would never make sense. The steeper the curve, the more important the field position battle becomes, and the more sense it makes to punt.
It’s the slope of the curve and not its absolute height on the y-axis that’s important when it comes to decision making. The risk equations for accepting or declining penalties, for onside kicks, or for coaches’ challenges does not change with an elevated EP curve, but it does change (slightly) for a steeper or shallower curve.


Shallow slope = explosive offense. What offense has the shallowest slope across this whole dataset?
Keep in mind that while it's true that an explosive offense will shallow the EP curve, it's also true that defense has an affect on the curve.
That's a lot of slopes to measure. I don't have that automated, but we can assume it's going to be the teams with the best net EPA/Play combining offense and defense. Without too much doubt that's going to be the '07 Pats.
Brian,
I'm sure it would be a major undertaking, but are the data available to go pre-2000? (apologies if that is explained elsewhere on the site) It might help parse out the difference between true changes in EP over time and iterative effects on total scoring. Not to mention that it would be fun to have WP data for some of those players.
I think FO has a project to digitize PBP pre-2000. I'd love to go back to the 50's, honestly. It would be a major undertaking.
Based on this chart, it seems like taking a safety is a little better than taking a punt from the end zone. (2 for the safety, and 0.7 for the kick off is better EP than -3 or so for the opponents starting on your 30.)
Is Arena football an example of "a football world with a perfectly horizontal EP curve" as the vast majority of possesions result in a touchdown regardless of where they start (based on personal observation rather than analysis). Of course punting is banned in that game but is the risk reward calculation of kicking a FG rather than going for it massively different from the NFL.
It would seem to me that a team's own defense would only influence the team's EP curve if EP scoring is defined the way you and Dave Romer do it. In the original Keith Goldner Markov chain model, a team's defense affects the slope of opponents only.
I'd be really curious to compare curves of exceptionally good defensive teams versus the best offensive powerhouses, via any EP model. The Ravens of 2000 and the 1985 Chicago Bears versus the Packers of 2010, perhaps, or those 2007 Patriots.
FYI...Sean Lehman has a website to help build a Retrosheet type database for NFL play-by-play data at footballproject.com...Hoever, it looks like it hasn't been active since 2009
So, any chance we will see the WP graphs utelize 2012 individual team EP during the playoffs? It could make for a more accurate model of the games (assuming weather, injury, etc are not major factors for the teams)
can you post all the teams?