
 In part 1 of this article, I analyzed the scarcity and consistency of fantasy performance at each position. We saw that picking the best available player is not the best strategy. In the second half of this article, I'll tie those two concepts together and outline a draft strategy that optimizes your expected points from your starters.
Summary and Observations
Here is a graph summarizing the drop-off curves for the performance of the offensive fantasy positions. Each position's drop-off is nearly perfectly logarithmic. (Wow--logarithms and fantasy football?)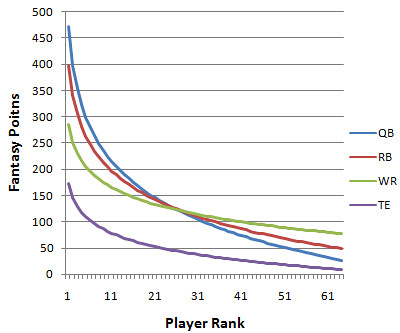
The graph above only factors in actual performance--it's a picture of scarcity and absolute point totals. It does not consider the different consistency levels of the various positions. The version below regresses the curves according to the consistency of each position, combining the concepts of consistency and scarcity.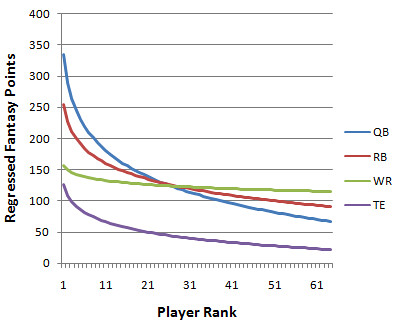
Compare the TE curve (purple) and the WR curve (green) in the graph immediately above. At no point does the TE curve exceed the WR curve in absolute terms. But the TE curve is steeper, which indicates that the differences between the top available TE and the next-best-expected TE is greater than that for WRs throughout the draft.
We shouldn't be concerned with the height of the lines, but with their slopes. Because each fantasy team is forced to start a certain number of players at each position, you only need to be concerned with the advantage you have within that position. If your TE is projected to produce 25 more pts over the season than the next best TE, and your WR corps is projected to produce 15 pts less than an opponent, you have a 10 pt overall advantage. It doesn't matter that WRs score twice as many points as TEs.
If everyone knew this, they'd jump on the top few TEs before even picking their first WR (in most years). But they don't, so you can take advantage by waiting to pick a TE until the last round before you think the first TE will be chosen. Just be sure to be the first guy to grab whoever is the Gates/Gonzalez/Witten/Clark of the current year.
Opportunity Cost
The best way to explain this strategy is opportunity cost. Don't pay attention to the overall ranking or projection of a player. Focus within positions. Judge the difference in value between the best player available in each position, and what you think the next best available player will be to you. In essence, calculate the cost of not picking the top available player at each position. The position with the highest cost should be chosen.
Say you have the 5th pick in a 10 team draft, and the previous 4 picks were RBs. You can estimate that between your 5th overall pick in the 1st round and your 16th overall pick in the 2nd round, there will be 8 RBs taken, 1 QB, and 1 WR taken. No TEs will be taken, so you don't even need to worry about them yet. So calculate the cost of not picking a RB, a QB, etc. You should calculate the difference between the #5 RB and the #13 RB, between the #1 and #2 QB, and between the #1 and #2 WR. Whichever difference is greater should be your pick.
Every year will be slightly different, based on the relative projections of the top players at each position. So we can't always say that a particular order of positions is the optimum one. But the 'opportunity cost' strategy will give you the highest possible projected point total for your starters coming out of the draft. It's not guaranteed because it depends on your estimates of how many players at each position will be chosen between your picks. But that isn't too difficult, and it can be updated as the draft goes on. Happy drafting.
Fantasy Draft Strategy Part 2
published on 8/18/2008


Subscribe to:
Post Comments (Atom)
Brian - This is a very interesting analysis - however, you are assuming that we know what the stats of each player will be at the beginning of the season. I charted the Position Rank (ex post) vs. the average of those players fantasy production for the year before (as a proxy for "projected" stats). Basically it shows the same as your graph, except that the slopes of the WR and TE are almost the same. I think this is explained by the fact that, while WR stats are not very auto-correlated overall, "top" WRs tend to be more a lot more consistent than average WRs and about as consistent as the top TEs. I can send you the spreadsheet if you are interested.
So you did the top 10 WRs instead of the top 32, or something similar? And they were as consistent as TE's? I used points rather than rank, but that's interesting, because the larger I made the samples for WRs, the higher the correlation. Top 64 was higher than for top 32, and top 96 was even higher.
I don't see why you say I'd need to know the outcome of players' stats before the season. It sounds like we did the same thing, I just used points and you used rank.
Perhaps I have confused the 2 main points of my article. The analysis was just to get a feel for how projections should be made, or how they should be weighted according to scarcity and consistency considerations. I'm just quantifying what many people already know intuitively.
The analysis led me to a system, which is the second main point--the opportunity cost system. You can use whatever projections you want under that system. I wouldn't suggest using a purely linear regression of last year's stats as a projection for this year.
(But it is an excellent starting point.)
My next post will illustrate exactly what I did and give an example of how it works.
Now I think I get what you did. I had to think about it a little longer. You plotted Yr n+1 fantasy performance vs. previous yr rank. That's clever. That way you could see how consistency levels change throughout the depth chart of the league.
Actually, I plotted year n Rank vs. year n-1 fantasy point production, but the information I'm trying to glean is the same - I'm trying to see how consistent fantasy production is by rank. The reason I did it this way is because this is an approximation of how people make their fantasy drafting decisions (which RB should I take first? The RB with the highest production last year...etc). Thus, I found that, on average from 1988 to 2007, the difference in REALIZED value from the PROJECTED #1 TE and the REALIZED value of the PROJECTED #2 TE (I'll call that "slope at #1") is about the same as slope at #1 for WRs. In fact, the slope at almost all points are pretty equal. I think this is saying that, although ex post it would be much better to pick the best TE than the best WR, ex ante you have no way of knowing who that will be, whereas you might have a better idea who the best WR will be.
My guess is that correlations are higher as you expand the number of WRs included because a large source of variability is TDs. Third and 4th WRs have low TD totals that don't vary much. Perhaps a look at consistency of yardage vs. consistency of TDs(which I'm guessing is low) would be useful.
i love this article
Does the # of roster spots matter? With only 1 QB and TE spot for most formats, who cares about QB and TE past rank 20? However, RB and WR in that range really matter. I'd guess TE is still better than WR, but RB jumps even more important early.
BTW, great articles. Really got me thinking.
Yea, it definitely matters if you are in a 1 QB league as opposed to a 2 QB league. In a 2 QB league, the scarcity measure makes drafting QBs much more important. In this scenario, you can easily justify taking Brady and Peyton over most running backs save for the top 2. This all depends on the scoring system of course, but I have found this generally to be true.
what about auction leagues? there you have no draft order just cash to spend.
How high was your correlation? Because I did the same thing as you (plotting point values v. rank) for the past 3 years and found a much smaller correlation than you seemed to. How many years worth of data did you use? Also what's your regression function?