
 A few days ago I posted a look at whether run gains increased the more often a team runs. In other words, does running more frequently wear down a defense and allow longer runs later in the game?
My analysis was pretty straight-forward. I numbered each team's run in each game, then plotted the average gain of every first run, second run,...20th run in a game. There was no increase in the average gain with later runs, and so I took this as evidence that frequent runs do not fatigue defenses and contribute to longer gains. What I should have said is I failed to find evidence to that effect.
Commenters had a lot of pushback on my conclusions, and for good reason. Among the criticisms were:
1. Late-game meaningless runs to run out the clock by teams with large leads will tend to be short because defenses expect runs.
2. Late-game runs within field goal range might be short for similar reasons. If a team only needs 3 points to tie or win, they'll almost always run the ball to avoid an interception, and defenses know this.
3. Average gain doesn't tell the whole story. It's helpful, but it's just one number.
So I did a few more things. I limited the data to runs when the score was within 8 points--a single score. I also limited the data to runs from outside field goal range, defined as the 34 yard line.
Also, instead of looking at average gains according to which run it was for each team in a game, I created a histogram. For those not familiar, it's a frequency plot of how often runs go for each amount of yardage. Knowing the average is good, and median might be better, but the full distribution can tell us much more of the whole story.
I grouped the runs into two sets of interest. The first set is each team's first 15 runs of a game, and the second set is for each team's 30th and later runs. If there are noticeably more instances of longer gains for the later runs, then we can say we have evidence for the run-fatigue theory.
Data is from league-wide regular season runs from 2000 through 2007.
There are far games with run attempts of 30 or more than games with up to 15 attempts, so I normalized the distributions. Each distribution is plotted as a percentage of the total in each group. For example, we'd read the graph by saying about 13% of runs 1-15 are for 2 yards. The same is true for runs 30+.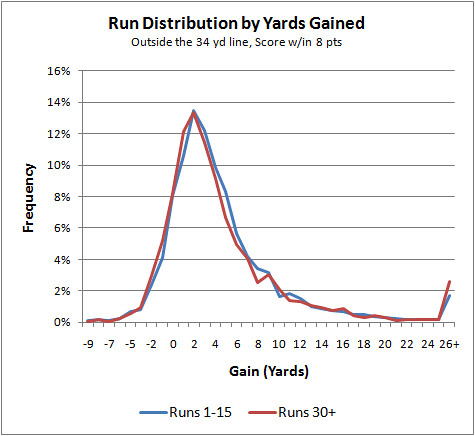
I won't make any inferences--for now. I'll just make some observations and let others draw their own conclusions. Please share your thoughts with comments.
The distributions are nearly identical, except in two places. The first place is kind of a quirk just short of 10 yards of gain. (There is an anomaly of NFL stat-keeping at 10 yards. If the ball passes 3 yard markers, it's a 3-yard gain. If it passes 4, it's a 4-yard gain, and so on, except for when the ball is within a yard of a 1st down. On 1st and 10, you can pass 10 yard markers and still only be credited with a 9-yard gain if the nose of the ball doesn't get past the first-down marker. Since 10 yards to go is by far the most common to go distance, the effect of the anomaly will be most pronounced short of 10-yard gains, making 9-yard gains more common.) Because there are far fewer late runs than early runs, the late runs are statistically more susceptible to this quirk.
The second difference is more relevant. Since there are so few gains beyond 25 yards, I grouped gains beyond that distance together. That's where the little up-tick is at the right end of the graph. Additionally, keep in mind that many, if not most, very long runs are touchdowns and are truncated by the goal line. An 70-yard run from an offense's own 30 could very well have been a 90-yard run had the line of scrimmage been a the 10 yard line.
There's a very slight advantage for the late runs. It's statistically significant, but extremely small--about 2.2% vs. 1.8% of runs beyond 25 yards. The significance, however, is possible only because the sample sizes are huge (n=33,952 for early runs and n=2,536 for late runs).
Establishing the Run? 2
published on 1/02/2009


Subscribe to:
Post Comments (Atom)
It seems like part of this effect could be that teams will commit many more of their defenders to the line of scrimmage late in the game when they need a stop, leaving fewer guys back to protect against the long run. If this were true, we would expect to see that the 30+ graph would be slightly shifted to the left for plays with short gains or losses to reflect the additional defenders on the line, which I think we do see from about -4 to 9.
That's pretty convincing. I could still see certain teams having different profiles (say Dallas and their big offensive line would wear defenses down a bit more) but it's clear that across the NFL there is almost no effect.
Could you do the same histogram per quarter? Madden is always saying that it's easier to run the 4th quarter. What I see a lot of is one team trying to run out the clock and the other team putting 9 or 10 guys in the box to stop it. And you get a lot of short runs and then a big breakaway run. It would be interesting to see if that showed up in your histogram.
I think you have the correct methodology but you're asking the wrong question. You are asking, "whether run gains increased the more often a team runs" and for that question, I agree with your results. But I don't have any doubt that, in aggregate, teams don't do any better running the ball in the 4th quarter than they do in the 1st. However, I do believe that stronger teams tend to have stronger running results as the game goes on. I will stress that this is just my belief, because I've done no hard analysis to back it up, but your analysis does nothing to invalidate this position either.
Yes, this is anecdotal, but I can clearly remember many times when the the underdog, who seemed to be scrapping along so well for 2+ quarters, finds itself eventually getting ripped for 5, 6, and 7 yard rushes late in the game. I can also remember plenty of times when an inferior team TRIED to steadfastly rush the ball in the 4th quarter and ran into nothing but a wall of stalwart defenders.
So my point is this, if you lump ALL of the teams together I have no doubt that they all perform no better on the ground in the 4th quarter than they did in the 1st quarter. The statistical effects end up canceling themselves out. But I would be extremely curious to find whether there is any noticeable difference in the rushing efficacy of relatively stronger teams as the game goes on.
You could argue, "If I filter out all the poor teams and underdogs, of course the remaining rushing results will look better, because those teams are demonstrably better to begin with." But my point is that you should test whether those better teams see a greater improvement (or any improvement at all) in rushing efficacy as the game wears on, as opposed to their inferior opponents.
Any idea what the variance on the sequential order of runs is? It is very possible that the averages are the same moving along during the game but there is more variance at the end of the game. The variance then produces the "pound it out" or similar effects that are observed and enable a team to win. Why there would be more variance I don't really have a good answer for, but might be interesting to see.
Data set something along the lines of:
Run 1: [3,3,3,3,3,3]
Run 20: [2,2,2,2,2,8]
Perhaps this was discussed in another article, but what happens to passing yards as the frequency of runs increases? Your first "establishing the run" article had a great graph showing that running more doesn't make running more effective. Would a similar graph showing average pass yards per attempt vs. prevous run plays be flat as well? Or does "establishing the run" succeed at improving the results of passing plays?
That's a good question. I looked at that exact question when I did this originally, but there is a problem with bias in the data.
Assume for a second that there is no connection, that team passing efficiency does not increase with more rushing attempts. But we know that winning teams rush more often at the end of games, and winning teams are usually good passing teams. So passes after high numbers of rushes will tend to be from winning teams, which tend to be good passing teams. So the effect will appear to be present even when there is no connection. I'd need a slightly different methodology to test the connection.