
 Two weeks ago I proclaimed Pittsburgh safety Troy Polamalu's interception return for a touchdown as the "play of the year." That single play snuffed out Baltimore's 45% chance of coming from behind to win a spot in the Super Bowl. Purely in terms of altering a team's chance of winning the championship, that play was easily the play of the year...until Sunday night.
Super Bowl XLIII featured three separate plays of dramatic importance, each more consequential than Polamalu's interception.
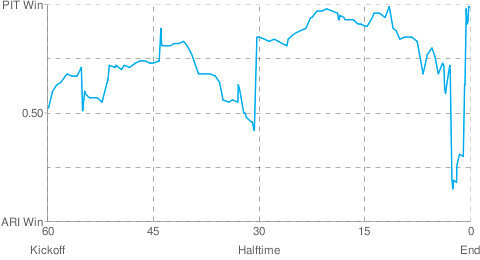
(Click here for the same graph with play-by-play descriptions. Hover the cursor over the graph.)
The first play occurred just before halftime. Down by 3 with 18 seconds left in the half, the Cardinals had a 1st and goal from the 1. With at least a tie guaranteed, the Cardinals likely had three tries at a touchdown and a 4 point lead. Instead, Steeler LB James Harrison picked off a pass and returned it 100 yards for a touchdown to end the half. This was at least a 10-point swing in the score, and possibly a 14-point swing. The Steelers' win probability (WP) went from 0.41 to 0.85, a change of 0.44.
The second play was actually the biggest in terms of WP. Down by 4 with 2:53 left in the 4th quarter, the Cardinals faced a 2nd and 10 from their own 36. Cardinal's QB Kurt Warner hit WR Larry Fitzgerald for a 64-yard TD to take the lead 23-20. This play took Arizona's WP from 0.30 to 0.80, a jump of 0.50. Unfortunately, the play was by the losing team, so it will be lost to obscurity as soon as Sunday night's Sports Center highlights end.
Despite being the most spectacular, the third play was not quite as decisive in terms of WP. With 35 seconds left in the game, Pittsburgh WR Santonio Holmes made an impossible 6-yard TD catch. Pittsburgh's WP went from 0.63 to 0.98, a difference of 0.35. But that doesn't count the play that put the Steelers on the 6 yard line and in position to score. Holmes' 40-yard reception two plays earlier swung Pittsburgh's WP from 0.30 to 0.60. In total, the entire scoring drive took the WP from a low point of 0.15 following the Steelers' 10-yard holding penalty to start the drive, to 0.98 after the go-ahead TD.
Incredible
published on 2/02/2009


Subscribe to:
Post Comments (Atom)
I'm not sure how to define the third play as not decisive. Maybe it is in your formula and I need to review it or I don't understand the scoring system you are using. Anyway the three plays you mention were swingers and the 40-yarder Holmes' reception made losing, for the Steelers, in regulation almost non-existent.
KA
It's only because they were already on the 6 yd line, and had at least a tie already in hand.
Found a few quirks in the play-by-play. Looks like it gets confused on PIT's TD that was challenged in the first quarter. It calls the game as PIT 6, ARI 0 (the little peak about a third of the way through). It also considers a touchback on the kickoff after PIT's TD (when the score was 10-0) as a safety (making it 12-0). That's the peak in the early second.
Brian, you could probably develop a metric to measure the "excitement level" of any game by looking at how far the WP line travels during the game.
That's true. The graph is basically a recording of the live status of the game. So if the refs signal TD, that's what will be recorded. Then if the play-by-play is updated with a change, it will calculate WP based on the update from that point forward. But it doesn't go back in time to fix past changes to the play-by-play.
eje-I've been trying to come up with a way to do a "leverage index" similar to what the baseball guys have. But football has so many more possible outcomes on any given play than baseball that it needs its own unique system. Suggestions are welcome.
I can think of a few ideas, such as number of times the WP moves through .50 or average slope of the WP graph, but haven't settled on anything. First, I have to define exactly what I'm trying to measure. "Excitement" is pretty subjective.
I wasn't online last evening, however, as I watched the 4th quarter I imagined this graph representing a seismometer positioned in Alaska. This is what my NFL playoff viewing has become in 2009, a line chart.
Can fractals be used to determine the irregularity of the chart?
Not familiar with fractal analysis. Was there any specific method you can point me too?
Hi,
Your site is great. You are absolute right about true winning Stats.
Here are some more:
DEFENSE WINS CHAMPIONSHIPS ...
... but not in Football.
Neither Pitt nor Arizona did stop the opposing Offense in this Super-Bowl! Granted, if the Umps did not threw the game, Arizona would have scored the winner. Only 40 yards to go and enough time to throw one or two more deadly passes by Great-Kurt.
Here are the Play-off Stats for Pitt:
Offense Avg. 28 Pts (29 % above NFL-Avg.)
Passing 6,5 Y/PP (13 % above Avg.). Great Game-Plan to come out throwing against Arizona. Then dull running to give Arizona a chance to come back, then back to a deadly Passing-Attack for the winning drive.
Rushing 2,9 Y/Run (32 % BELOW Avg.). So much about the saying you need to run the ball to win. Pitt could hardly move the ball on the ground in those 3 Play-off games, even against a "soft" Arizona-Team, they only managed 2,2 Yards per carry!
Turnover-Differential +6 (that is always a big indicator for winning. Because the team being behind always passes more risky instead of efficently, while the leading team runs the clock down. For me that is the only reason at all why you should run the ball. For that: Hail Martz forever. I know all guys will clobber me for that. But he made bad teams to winners or at leat competitors)
Defense Avg. 20,3 Pts (only 8 % below (= better then) NFL-Avg.)
Passing 6,6 Y/PP (14% ABOVE Avg.). If the saying is true that Defense win Championships, the Avg. should be below League-Avg., not above. It means in the 3 Play-Off Games, Pitts Defense performed WORSE then the Avg.-NFL-Team. That includes such great Defenses like Detroit, New Orleans and Denver. hahaha
Rushing 2,5 Y/Run (40% below Avg.). The only true Defense Domination by Pitt in the Play-offs. But then again: for what? Opposing Teams carried the ball only 48 times total (16 runs per Game) in 3 games. Remember the defense gave up 20 Points per game (= just a little bit better then NFL-Avg.).
If opposing coaches would not have rushed at all (exception: always run on short field (near Goal-Line) or short downs (4th and 1, 3rd and 1/2)), Pitt would have lost its first Game (Rivers threw EFFICIENT for 308 Yards and a 105 (!!) QB-Rating). What i say is quite the opposite of what Greg "Easteregg" is preaching every week. But in contrast to your site, this guy is complete wrong.
Conclusion: Pitt did stop NOTHING, except a dull Baltimore Offense with a Rookie-QB!!
They won because 1.) Roethlisberger came back to true form (91 QB-Rating in Play-offs),
2.) they got the luck, which is needed nowadays to win the NFL (3 Return-TDS: one came off an ill-adviced pass by Kurt the great, one came on a Punt-Return by one of the worst NFL-Special-Teams and one came off a Rookie-QB-Int) and
3.) the Umps/Refs/Vegas/Mob helped them.
P.S.: i have those stats for the whole history of Pro-Football (including AFL and AAFC). It shows that the Offenses outperformed Defenses by a slight margin. It also shows that PPG go up (!!) in the Play-offs (in COLD weather) and more up in Super-Bowls. So to say Defense wins championships is absurd!!!
Just remember the now hailed NYG-Defense of last year (they gave up MORE points then the Avg.-Team during the regular season). It is a big joke to hear the same lie every year. It bores me.
What is your opinion? I mean the numbers speak for itself. They can not be discussed away by those preachers of dull "70s-Football".
I know guys did not like Arizona in the Super-Bowl, but the realy earned it (compared to the lucky Giants of last year, by far the worst team ever to win the Super-Bowl).
Y/PP in Play-offs: 8,1 by Kurt the Great !!!!!!!!
You wrote the Super-Bowl Winners won because the Defense stopped the opposing run efficiently. We should not forget why it is like that: Once you lead, you run the clock down, while the opponent is passing. I am sure if those 80s and 90s Super-Bowls were close as nowadays, Montana, Young, Aikman, Simms and Co. would have passed for 500 Yards EFFICIENT per game. Always remember: You win with great passing (i.e. Y/PP). Can you name the Starting-RBS for all those SB-Winning teams? Only Emmit Smith was known as a great one.
Recommended books:
"Interference: How Organized Crime Influences Professional Football" by Dan E. Moldea
and
"You're OK, It's Just A Bruise: A Doctor's Sideline Secrets About Pro Football's Most Outrageous Team" by Rob Huizenga
Excuse my english, i am from germany.
Ciao, Karl
Thanks, Karl. Your English is better than my German.
Also, I was thinking there must be a handy measure of volatility the stock market guys use that would work very well as a measure of "excitement."
I'm not the guy to teach, but you might start here: http://www.vanderbilt.edu/AnS/psychology/cogsci/chaos/workshop/Fractals.html and follow the link at the bottom.
What if for every play you keep a running total for the changes in win probability. Disregard which direction the graph goes; just keep track of the amount of the changes and sum them all up. At the end of the game, a higher total should mean that the game was more exciting.
Brian-I was thinking the same thing, but there are lots of games where the WP bounces between .75 and .85 for most of the game. That's not nearly as exciting as if it were bouncing between .45 and .55. I think part of it has to incorporate how close to .50/.50 you are.
One easy way to measure the "excitement" of the game would be to look at the cumulative change in probability of winning each side generates during a game. The difference between the two is always 50%, but as one team improves its chances, the other has to make up that change if they are to win.
So add up all the positives for the winner and the loser. A ratio or difference would provide a scale. If a team has to do 250 "improvement points" it had to work harder than a team that needed 100 to net the 50. The presumption is the game went back and forth more.
JMM and Brian-I'll try that for a few games and compare the results.
What about something like this: http://en.wikipedia.org/wiki/Volatility_(finance) ?
Or this:
http://en.wikipedia.org/wiki/Stochastic_volatility?
I'm sure those can serve as foundation. I do like option volatility better than stock volatility as a starting point. Options, like football games have an end point ( 0:00 4th Q - strike date) and two possible outcomes(win/loose - exercise or not.)
This might allow incorporating some timeline component (I haven't looked at any of the models). Swings in the 4th quarter are more exciting than changes in the first (which are often just thought of as mistakes.)
Pitt had a 100 win probability with about 12 minutes left. Is it possible to adjust the system since 0% of the teams have won in that predicament, but a certain % (like 20) have come back to have a win probability in their favor later in the game (>50%) only to lose it. Can you adjust based on the likelihood a team will win win in that situation rather than use past results to predict future outcomes.
It was actually 0.99. Down by 13 points with the ball on their own 13 yd line with 11:30 left in the 4th.
Yes, it's true that no team has won given that general situation (inside own 20 with 11-12 min remaining. Teams are 0 for 3 in the last 8 years. But that's not saying much, because 3 is not a large sample size by any measure. So the model averages data from "surrounding" situations to help increase the sample. For example, teams down by 13 with the ball inside their own 20 at any time in a game, only won once out of 148 cases. And 9 out of 145 teams won down by 13 with the ball between their own 20 and 40 yd lines with between 10 and 20 minutes left. 1 out of 28 teams won down by 12. This isn't exactly how the model works, but it's the best way I can explain it. There is a of curve fitting and smoothing/noise reduction.
So depending on the modeling function I use, the estimate could come out to be .99 or .98...possibly .97. Either way, I'm confident the real answer is close to the .99 number. And indeed, PIT won the game.
But as you point out, ARI came back to have a >.50 WP. That by no means makes the .99 (or .98 or any other WP for PIT better than .50) incorrect. It's the likelihood PIT will ultimately win the game, not the likelihood they will keep the lead throughout the rest of the game. It already accounts for the possibility that they'll lose the lead and may come back to win.
My model is an empirical model. Think of it as lots of locally-weighted regressions. It's not just a straight-up comparison to past games that are exactly the same the current game state. (Although, my very first beta "concept-demonstration" versions did exactly that.)
All types of models use past results in some way to predict future outcomes. The other way to model WP is a theoretical simulation. You take the current game state and simulate the game from that point forward many times. The WP would be the % of simulations each team wins. But what would you use simulate the game? You'd need past drive outcomes or play outcomes or data for whatever level of simulation you're attempting.
I feel some of the misunderstanding of the graph comes from a misunderstanding of statistics in general.
Just because a team is very unlikely to win doesn't mean that they won't. For example, had Arizona won when their WP was 1% at one point doesn't make the model incorrect, it is just what happens when you have a very small sample size (1, in this case).
For a more serious application of misunderstood statistics, see the case of Sally Clark who was imprisoned for the murder of her two sons on the grounds that her defence, that they both died of SIDS, was extremely unlikely.
I guess the moral of the story is that just because something is unlikely to happen, that doesn't mean that it won't.
From the linked article:
"At this moment, the Rockets’ front office would later calculate, the team’s chances of winning rose from 19.2 percent to 72.6 percent. One day some smart person will study the correlation between shifts in probabilities and levels of noise,"
http://www.nytimes.com/2009/02/15/magazine/15Battier-t.html?_r=3&ref=magazine&pagewanted=all
A crude approach would surely be to just calculate the length of the line in the graph. Overall, the line has to get from 0-60 minutes and a relatively flat line will be shorter than a line with lots of steep bits and changes of direction.
A meandering line will be physically longer than a straight line, given that, as I say and as is obvious, the line must start at 0 and end at 60.
I feel like I haven't explained myself all that well, but it makes sense in my head...