
 There's a lot to be learned about what makes football unique from other sports. I recently built a live win probability model for NCAA basketball, and now I've started looking at NHL hockey. Instead of doing the same kind of win probability modeling, which would nevertheless be interesting, I thought I'd take a completely different approach.
Let's say you have a hockey team that scores 3 goals per 60 minute game. How likely are they to score exactly 3 goals? 2 goals? 4? The Poisson distribution can tell us.
Given that there are on average x occurrences of an event over a time period, the probability there will be exactly k occurrences is:
Hockey is an example of a fluid sport, and it's ideal for Poisson analysis. The clock rarely stops and control of the puck goes back and forth between teams often, and much of the time it's not even clear if either team has control. Goals are relatively rare, and are approximately equally likely to occur at all moments throughout a game. Soccer and lacrosse are also examples of this type of sport.
This season NHL teams score an average of 2.8 goals per 60 minutes. To calculate the probability of a team scoring exactly 3 goals in a game, the Poisson distribution tells us it's 0.22. The probability of a shutout, zero goals, is 0.06.
We can go further and apply this to specific teams. For example, the Boston Bruins, which are currently the NHL's top team, score 3.3 goals/game and allow 2.2 goals/game. Their distribution of goals scored and allowed for a single game are plotted below. As you can see, the higher goal amounts are obviously going to be more common for goals scored than allowed.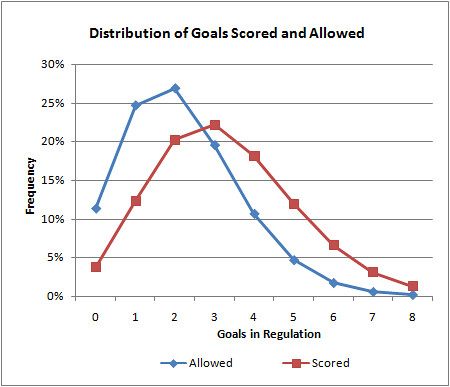
How is this useful? We can calculate the Bruins' expected winning percentage by summing the probabilities of all the possible combinations of outcomes--1 to 0, 2 to 0, 2 to 1,...The cumulative probability of all outcomes in which the Bruins outscore their opponents reveals an expected win%, similar to the Pythagorean expectation developed originally for baseball.
Using this method, the Bruins can be expected to win 60.0% of the time outright. In 15.8% of games, they can be expected to be tied at the end of regulation. Overtime in hockey is a single 5 minute sudden death period followed by a shoot out if necessary.
OT outcomes are far more random than the rest of the game because it's not who scores the most; it's who scores first. Besides, a tied game in regulation suggests the teams are relatively evenly matched, at least on that day. So for now, let's say the Bruins will win half of their OT games. They should be a .679 team, and in fact, they're currentlly at .642. We might say, if anything, they're a little better than their record indicates.
In part 2, I'll describe a method for estimating game probabilities for particular team match-ups. But before I sign off, I want to be clear that I doubt anything I've done here is original. I know for a fact that hockey analytics guys use Poisson modeling extensively. And I doubt this has much relevance to football. In fact, that's the point. It's unlikely that there's much about football that is Poisson, and that's worth understanding (if true). Besides, I like to investigate what make various sports unique.
Comparitive Modeling: Hockey as a Poisson Process 1
Pr = xk e-x / k!
published on 3/09/2009


Subscribe to:
Post Comments (Atom)
Nice work. I have a background in math in general, but not statistics in particular. Give me an equation (like you did) and an explanation in plain English (like you did, unlike what Wikipedia does), then I'm good.
I'm eagerly awaiting part two of this post. I'd love to incorporate some actual game projections on my website, and you've given me tools to get halfway there. :)
I got through cal 303, but only stats 101. You guys make my head spin. Keep the equations coming--they help us theoretical guys understand the practical much better.
By the way--I keep wanting to figure out the area under the curve. Does that make me strange?
I agree that hockey goals follow a poisson process... almost. But you should probably account for the last two minutes of the hockey game when a team is trailing by one or two goals, they will pull the goalie. At this point the poisson parameters change for both teams. Knowing this, the actual likelihood of a two goal margin of victory is higher than what 60 minute poisson modeling would suggest.
I think Doug Drinen has shown that TDs are likely Poisson distributed for an individual player. What about yards? Seems like that would be normal. And, if fantasy points are based on TDs (poisson) and yards (normal?), what's the distribution of fantasy points for an individual player averaging X fantasy points/game? Normal as well?
I think this is important in determining the variability of fantasy football scoring. Because TDs are usually worth more than yards and you only get full TDs (instead 47 yards for 4 or 4.7 pts, you get 6 for a TD or 0 if your player doesn't score). Thus, it seems, that a two players averaging the same amount of fantasy points/game, there will be more variability for the player who's scoring is more dependent on TDs than yards.